July 3, 2023
The Dairy Industry: Review of 2022 and a Look Ahead
Volume 17, Issue 7
July 2023
Note: This article is also published in the 2022 Northeast Dairy Farm Summary and 2023 Mid-Year Outlook. Read the full report for more information.
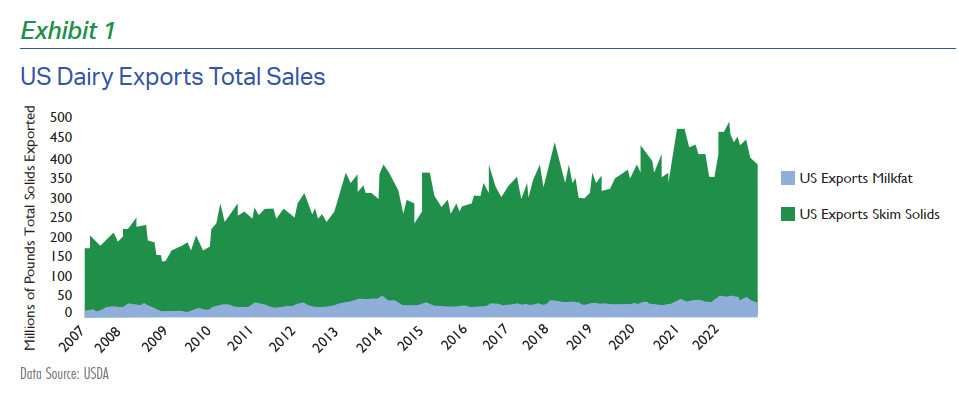
2022 U.S. Dairy Exports Hit Record
U.S. dairy exports hit new records in 2022, reaching 5.27 billion pounds of total solids exported (milkfat and skim solids content combined). This figure represents an increase of 5% from 2021, accounting for 17.8% of U.S. farm milk production. Mexico and Canada are the largest U.S. dairy export markets, representing over one-third of the $11 billion dollars of total U.S. dairy exports. China, Philippines, South Korea, Japan, Indonesia, Vietnam, and Malaysia collectively account for approximately another one-third of total U.S. dairy export value, while the remaining third is spread out across dozens of other countries. A major milestone was passed in 2021, with U.S. dairy export sales (on a total solids annual basis) surpassing total U.S. fluid milk sales for the first time, likely the culmination of a long-term industry trend. The increased importance of dairy exports for the U.S. has been building for a long time due to a variety of market and policy factors, including the continued fifty-year decline in U.S. fluid milk sales and the more recent trend of increasing demand for dairy and protein in foreign markets. Long-term per capita GDP growth in many emerging markets and more open trade policies have also played a role in boosting U.S. dairy exports. As a result, U.S. dairy manufacturers have focused more of their attention on dairy products that are in high demand in foreign markets (cheese, nonfat dry milk (NDM), high protein whey products, lactose, and other milk powders rather than fluid milk).
U.S. promotional checkoff efforts, along with fluid milk product development, have done little to curb the long-term decline in per capita fluid milk sales domestically. One potential contributing factor is the proliferation of beverage choices available to consumers, where sports drinks, plant-based products, juices, soft drinks and flavored waters compete with milk for market share. While shifting beverage consumption patterns have presented challenges for dairy farmers who are in heavy Class I utilization areas that have traditionally relied on fluid milk sales, new opportunities have also been created for U.S. dairy producers to expand their milk production and enter new markets. In the Northeast FMMO, Class I milk utilization has fallen from 44% in the year 2000 to 30% in 2022. This trend coincides with Northeast FMMO producer price differentials (PPD) generally drifting lower in the past twenty years, with average PPD from 2000 to 2009 being $1.86 per cwt. and from 2010 to present averaging $1.49 per cwt. Approximately one day’s worth of U.S. farm milk production per week is currently being exported, which has roughly doubled over the past 15 years. Increasing U.S. dairy exports helps provide market outlets for the substantial U.S. milk production growth that would otherwise be difficult for domestic demand alone to absorb. Domestic demand for total milk solids has only grown by 1.2% on average annually in the past decade, while exports have increased an average of 5.2% annually. Additionally, U.S. population growth has been declining over the past few decades, with some estimates suggesting forward growth rates of only 0.4% to 0.5% annually. These figures highlight the increasing need for export growth. Going forward, it is expected that 40 to 60% of all additional US skim solids produced will need to be exported.
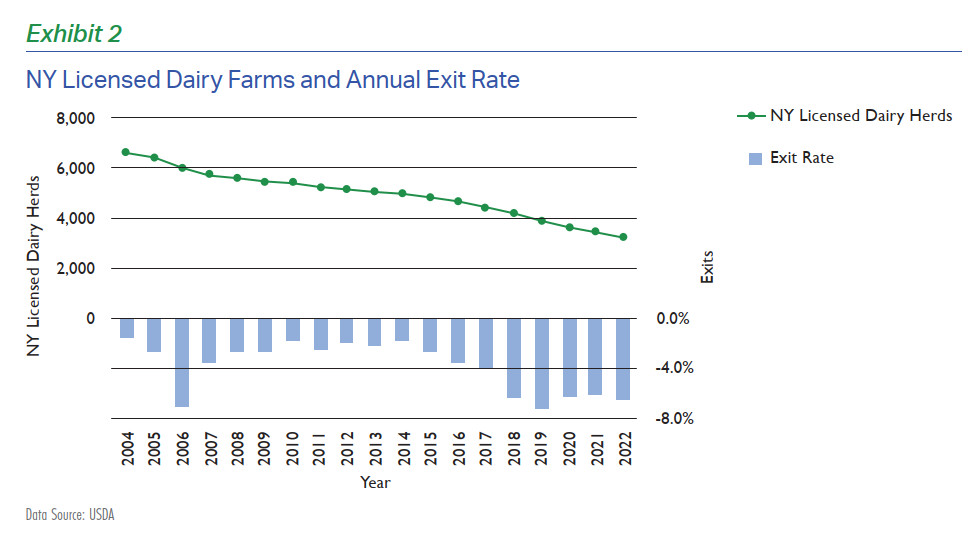
Rising Farm Exit Rates and Continued Consolidation
The dairy industry in the United States has generally experienced increasing annual exit rates for dairy farms in recent years, in part due to the “Baby Boom” generation reaching retirement and a lower desire among younger generations to take over family operations. Smaller operations continue to face challenging financial conditions, as economies of scale cannot be replicated for smaller herds. U.S. licensed dairy herds declined 6.4% in 2022 (to 27,932 operations), which is an acceleration of the 5.7% exit rate in 2021. Licensed dairy herds in New York dropped by 6.4% in 2022 (to 3,210 operations). Throughout the past 50 years in the U.S., the number of licensed dairy herds has declined by roughly half each decade. If this trend persists, U.S. operations could fall to around only 7,000 operations within 20 years. The inception of Dairy Margin Coverage (DMC) has partially offset the attrition rates of smaller farms, allowing smaller operations of less than 200 cows to remain more financially viable. DMC payments were roughly $2.59 per cwt. at the tier 1 coverage level ($9.50) in 2021 and only $0.19 per cwt. in 2022. DMC payments are forecast to be near $2.00 per cwt. in 2023. The upcoming Farm Bill will be critical in ensuring safety net programs (such as DMC) remain in place for dairy producers. The consolidation of the dairy industry remains a continuing trend as cost of production estimates suggest $2.00 to $4.00 per cwt. cost advantage for large dairy farm operations .
Most of the new dairy operations being built are centered around Texas, Kansas, South Dakota and Idaho. Meanwhile, cooperatives have diminished in importance as a primary engine for growth, as most new capacity in the next few years are private projects. In many cases, smaller producers currently have limited opportunities to grow as many processors and cooperatives are employing supply management or quota programs. The overall trend of increasing dairy farm exit rates raises concerns about the long-term viability of small dairy operations and the possible negative impact on rural communities as more farms consolidate.
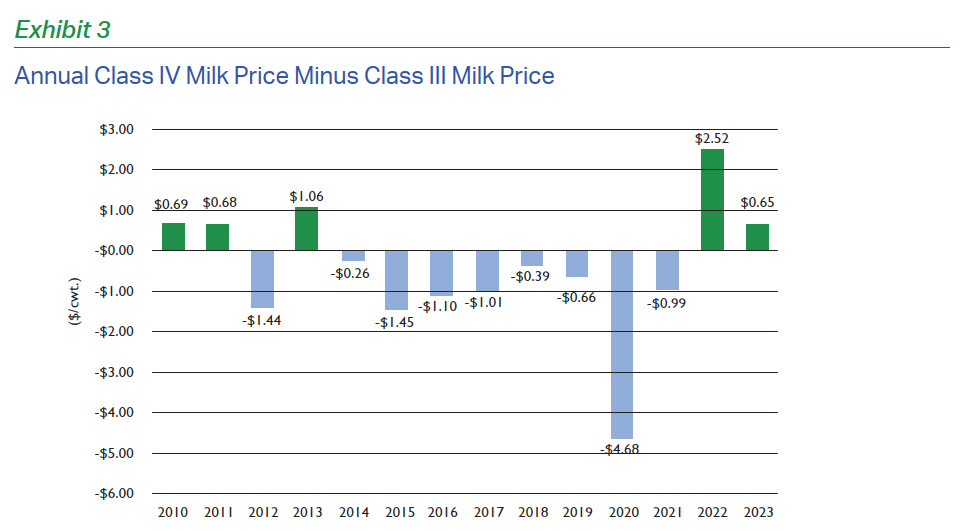
Record Butterfat Prices and Large Class IV Premium
Butter prices in the United States reached record highs in 2022, averaging $2.86 per pound for the year with a peak of $3.27 per pound. Structural demand changes within the last decade place more emphasis on healthier fats, such as butter, likely contributing to these price increases. An increasingly negative stigma has been attached to vegetable oils and margarine for health-conscious consumers, while butter markets have benefitted from the switch to what are perceived as more wholesome sources of fat in consumer diets. Additionally, U.S. butter production has been lagging, with 2022 butter output declining 0.7% from 2021. New plant capacity seems to be more focused on cheese production at the expense of butter/powder plants. Dairy producers at the farm level have continued to respond to higher butterfat prices over the last ten years by formulating feed rations to optimize fat content, with national average fat tests exceeding 4%. Class IV milk prices reached a new record high of $24.47/cwt, which was $2.52 above Class III milk prices during 2022. New York margins were strong overall in the first half of 2022 despite generally high operational costs.
Following large-scale trends in the overall economy, labor and general farm overhead costs continue to hit record levels as businesses struggle to find and retain workers. Higher feed costs in the past two crop years have also been challenging for many producers due to higher-than-normal drought impacts.
Key Trends
Economic Outlook 2023
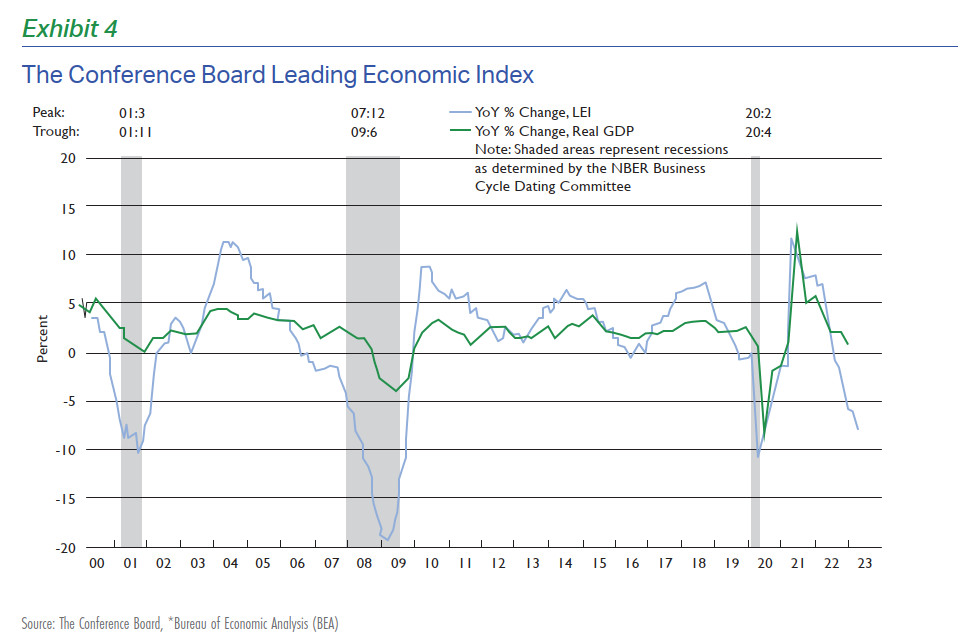
Many economists and media articles have been predicting a U.S. recession since mid-2022 when the Federal Reserve began raising interest rates to combat inflation that was at its highest rate since the 1980s. In the span of just one year, the Federal Reserve raised the federal funds rate from near-0% to around 5%, marking one of the most aggressive Fed tightening cycles seen in the last forty years. Inflation exceeded 8% in 2022, sparking the Fed to dramatically shift its previous viewpoint that inflation was only transitory while recovering from the COVID-19 pandemic. The numerous recession predictions during the start of the tightening cycle were perhaps a bit premature, but a potential economic slowdown in 2023 is likely still imminent. However, current economic indicators are not quite at recession levels, with labor markets remaining strong and GDP likely remaining positive in Q1 2023. Still, it is important to note that every recession begins looking like a ‘soft landing’ before economic downturns become more widespread. In general, the composition of the U.S. economy is increasingly service based, which tends be less cyclical. Almost 87% of jobs are in service sectors, compared to only 13% for the manufacturing and construction sectors where most recession-related job losses come from.
A few leading economic indicators have shown troubling signs over the past six months, with The Conference Board Leading Economic Index® forecasting mild recessionary levels. Leading indicators can show the direction or trend of the economy more clearly than employment or GDP numbers, which tend to lag and are often subject to revision.
Recent bank runs have also caused stress on the financial system, forcing the Treasury, the FDIC, and the Federal Reserve to act to shore up confidence in the system. Credit conditions will also likely tighten, which could cause a drag on consumer spending. Many smaller regional banks saw plummeting deposits while other alternatives, such as T-bills or money market accounts, offered superior interest rates near 5% over simply storing cash in a bank account near 0%. In addition, regional banks are perceived to be less likely to be bailed out than the ‘too big to fail’ mega banks. The odds of a recession are certainly elevated for the remainder of 2023 compared to the baseline recession frequency of around 20% for any given year, with the consensus among economists placing the odds of a recession at around 50%. It is important to remember that unemployment is typically a lagging economic indicator that tends to rise more in the later stages of a recession. Thus, it is important to focus on leading indicators when forecasting a potential recession.
Risk Management for Dairy Producers
Proactive dairy producers that plan for risk management tend to outperform their peers and have a greater ability to expand their business. Risk management plans do not necessarily need to be complex to be successful. Rather, a consistent plan that holds producers accountable for actively managing their business risks is merely the most important element for success. Predicting the exact timing of price highs and lows within the dairy and feed markets is extremely difficult and should not be the primary goal of a risk management plan. In reality, the nature of commodity markets makes it impossible to know precisely what milk prices will be in six months or a year from now. Even market experts that frequently appear at conferences or in prominent dairy publications are typically no more accurate with their predictions than the current futures market prices. It is extremely difficult to predict with more accuracy than the collective wisdom of everyone participating in the futures market. Therefore, dairy producers’ efforts are best focused on consistently managing risk and acting prudently when profitable margins can be protected. The most important part of risk management is to be proactive and have protections in place before a major crisis strikes, such as the pandemic or 2008/09 financial crisis. Consistent hedging with available tools such as DMC, DRP, LGM, and futures/options is one way to proactively secure protections. It is often too late to act when a crisis strikes, as the dairy futures and options markets rapidly react to heightened risk in milk prices. Consistent hedgers that layer over time are more likely to have coverage in place for a crisis and realize better results.
Dairy Margin Coverage (DMC) is a foundational tool of risk management, especially on the first five million pounds of production, with long-run estimated payments near $1.50 per cwt. annually. The next layer of tools include DRP and LGM insurance with subsidized premiums, where coverage can act as a floor on milk revenue in which a producer is not giving away any potential upside but rather putting a minimum revenue level in place to protect from falling prices. However, it is also important to manage expectations when buying DRP and LGM insurance. Many of the larger indemnities come from rare events that occur once every three to five years and are nearly impossible to predict ahead of time. Thus, there will be many instances of paying insurance premiums without collecting indemnities in normal years, but without continuous coverage a crisis could be especially damaging. The DRP and LGM programs are designed and actuarially rated so that, with subsidized premiums, dairy producers are likely to have net positive indemnities (indemnities greater than premiums paid) in the long-run. The last pillar of risk management is futures, options, and forward contracting, which can be utilized in conjunction with other strategies. Some producers sell call options to cheapen the cost of DRP premiums while capping upside potential in milk revenue. Forward contracting or selling futures is another tool that could be used; however, it has the negative of not being subsidized and it also caps market upside potential.
Assuming that coverage is booked with consistent layering, the simulated average DRP returns for New York from 2011 to 2022 substantially outperform the strategy of selling Class III and Class IV futures. Assuming layering coverage for five quarters out on average in Class IV, DRP also resulted in a return of $0.41 per cwt. from 2011 to 2022 versus a $0.05 per cwt. return on simply selling Class IV milk futures. Likewise, Class III DRP resulted in a return of $0.01 per cwt. versus a -$0.60 per cwt. return on selling Class III milk futures.
Possible FMMO Reform and Impact for Producers
The Federal Milk Marketing Order (FMMO) system, which governs the pricing and marketing of milk in much of the United States, has faced several challenges and criticisms in recent years. The FMMO is a valuable program for dairy farmers that aims to provide orderly milk marketing and price transparency. The National Milk Producers Federation (NMPF) surveyed its members on FMMO issues, and they found that member co-ops overwhelmingly supported the federal order system but agreed that provisions need to be modernized. The major tenants of the recent NMPF proposal are analyzed below.
Make Allowances
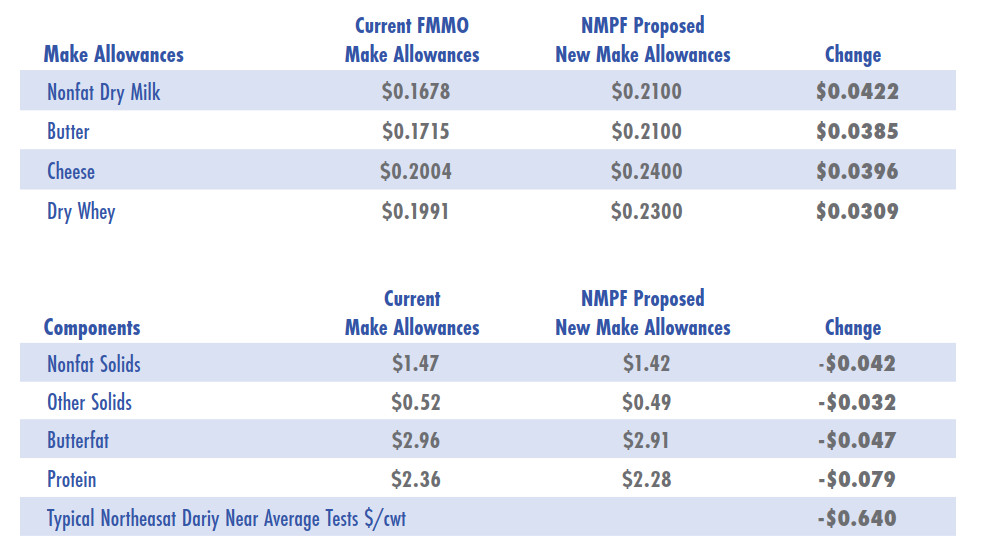
Make allowances have been a difficult issue for the industry because they have a direct and immediate impact on Class pricing and producer milk checks. Make allowances are supposed to reflect the cost of manufacturing commodity dairy products while still leaving a return on investment after expenses for the manufacturer. The National Milk Producers Federation, NMPF, has proposed increasing the FMMO processor make allowances to the following: Cheese $0.2400 per pound, Dry Whey $0.2300, Butter $0.2100, and NFDM $0.2100. Make allowances were last increased in 2008, marking almost 15 years with no changes. Most agree this is an unacceptably long period of time without any adjustments. If implemented, these would decrease Class III milk by $0.58 and Class IV milk by $0.53 per cwt., assuming no changes in yield factors (i.e., the number of pounds it takes to convert milk into commodity dairy products). The primary dairy processors selling commodity style products (cheddar cheese, NDM, sweet whey, and bulk butter) that are captured in the NDPSR report are most negatively affected by the lack of increases to make allowances. Other dairy sellers can simply increase the price of their products to compensate for higher manufacturing costs. Additionally, steep discounts in barrel cheese prices over the last five years have padded cheese producer make allowances, because cheese producers pay for milk on a 50/50 split between blocks and barrels and mostly sell against the block cheese market, pushing up margins by on average close to $0.04 per pound because of the barrel discount.
NMPF wants to develop a process to ensure manufacturing allowances are reviewed more frequently. A survey process every several years could serve to streamline the arduous current process and likely make future adjustments more tolerable as opposed to a sharp dramatic increase every decade.
Revert Back to Higher of Class I Mover
NMPF also wants to revert back to the “higher-of” in the Class I mover in place before 2019. The industry was mostly in favor of the “average of Class III and Class IV” mover until a period of abnormal dairy price spreads caused the industry to panic. Many producers were angered as a result of the impact of the Farmers to Families Food Box program. Class III milk prices increased dramatically due to heightened government cheese purchasing, while Class IV milk prices lagged behind. This resulted in sharply negative PPD in milk checks during 2020. The “higher of” switch complicates hedging for fluid milk buyers, but this factor alone has had little impact on fluid milk sales at restaurant chains. The pendulum has swung back in favor of “higher of” Class I milk mover, and this will likely help to slightly bolster prices for a Northeast dairy producer.
Discontinue Barrel Cheese Price and Update Milk Component Factors
NMPF wants to discontinue the use of barrel cheese in the protein component price formula. The barrel cheese market has had an outsized influence on regulated Class III milk prices, where current rules assign roughly a 50/50 split between blocks and barrels when determining average cheese prices. In reality, most formula-based cheese prices reference the CME block market, with some industry analysis suggesting around 80% of all cheese is based on the block cheddar market. Removing barrels from the price formulas would likely provide a more accurate reflection of market conditions for most cheesemakers. It would also aid regulated producer milk prices, as the barrel price has tended to trade at a large discount compared to the block cheese market in previous years.
NMPF is also considering updating the milk component factors for protein, nonfat solids, and other solids in the Class III and Class IV skim price formulas. The average farm butterfat and protein tests have risen considerably over the years as improved herd management, better cow genetics, and more optimized feed rations have boosted component levels. An increase to 4.0% butterfat and 3.3% protein appears to be the new benchmark for the industry. This change serves more as an accounting exercise than a meaningful change in policy, but it does make things a bit easier to benchmark for a typical representative farm component test.
Class I Price Surface
NMPF wants to update the current nationwide FMMO Class I price surface by an average of $1.48 across all orders (to $4.07 per cwt.). The Northeast region has a slated increase of $1.76 (to $4.64 per cwt.). The rationale behind such changes is the increasing cost to deliver bulk milk to fluid processing plants. As a result, the current Class I differentials have become increasingly inadequate to effectively supply milk for fluid use, thereby creating disorderly marketing conditions. The increase in the Class I milk price surface would offset a significant amount of the decline from the increase in processor make allowances.
Next Steps and Overall Producer Milk Check Impact
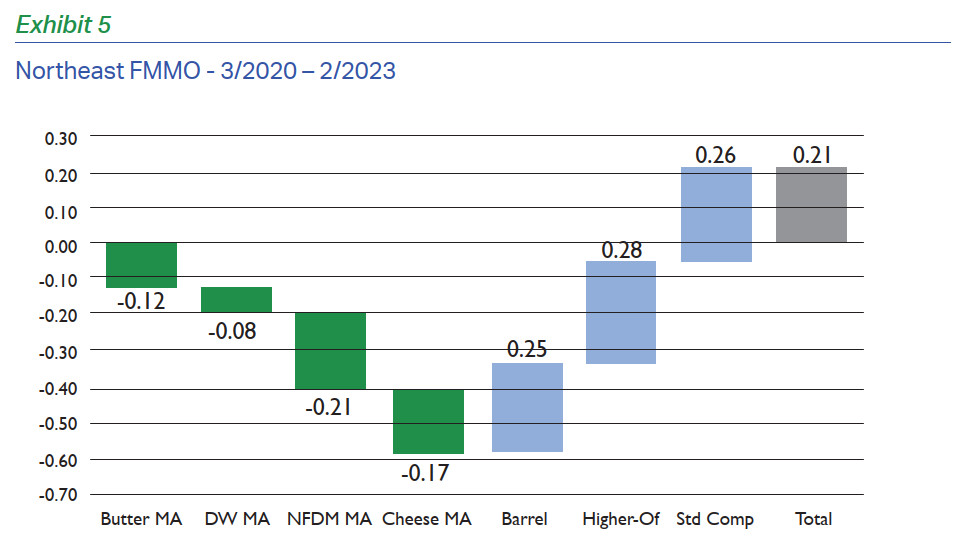
A hearing process will likely take place on FMMO reform in 2023. The last major changes in 2008 took nearly two years to implement. The estimated price impacts for a typical Northeast dairy producer at average components from various rule changes are: -$0.12 on butter make allowance, -$0.08 on dry whey make allowance, -$0.21 on NDM make allowance, -$0.17 on cheese make allowance, +$0.25 on removing barrel cheese, +$0.28 on the Higher of Class I mover, +$0.26 on standard components, and a total result of $+0.21 per cwt. These figures do not include the adjusted Class I price surface rule, which likely would boost price on average by about another $0.50 per cwt. for the Northeast producer.
Milk Plant Capacity and Vertical Integration
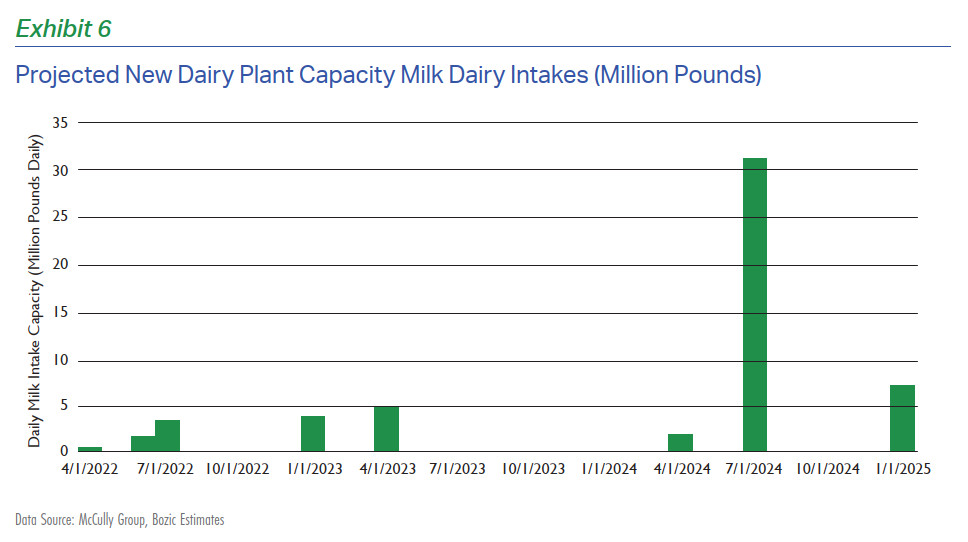
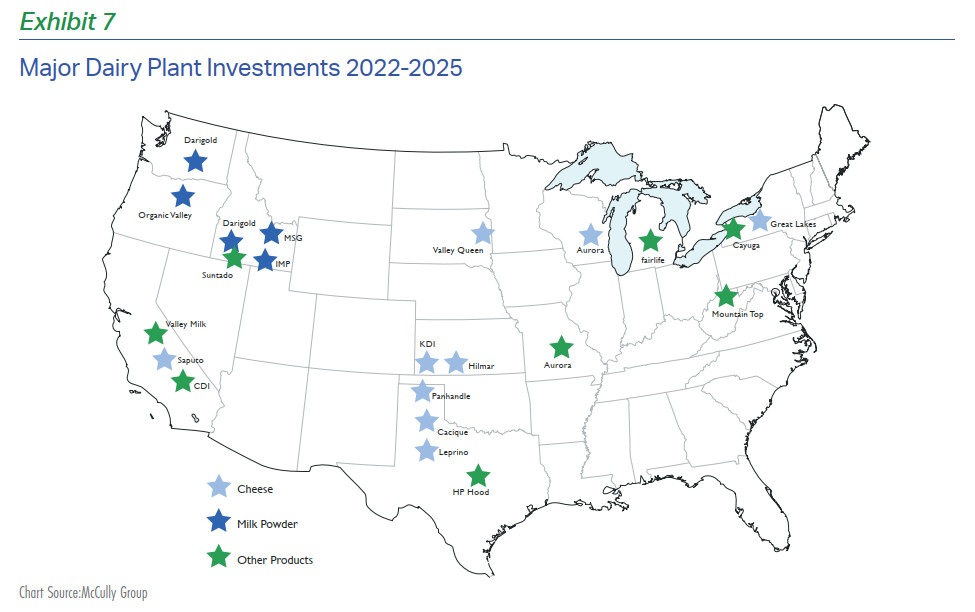
Milk plant capacity growth is increasingly driven by groups of large dairy producers through private projects, with a limited appetite for expanding milk plant capacity from cooperatives. Large family dairy operations are increasingly involved in new processing plants to grow milk production, adopting a more vertical integration process like the pork, cattle, and poultry sectors. This approach allows companies/farms to capture a larger share of the value chain, as they can more easily manage the quality and cost of raw materials, streamline production processes, and have greater control over product pricing and distribution. It allows for greater efficiency in operations, as well as the ability to respond more quickly to changes in the market. Many cooperative milk handlers have put quotas or limits on milk production growth, so producers are striking out on their own to make these investments which are often in fringe FMMO areas. A sizeable jump in U.S. milk plant capacity is expected in about 18 months, coming after a relatively quiet period of plant expansion during 2022/23. Major plant expansions could bolster U.S. dairy processing capacity by 11 billion milk pounds annually, or almost 5% greater than 2023 capacity in the latter half of 2024 and early 2025. The Dodge City, KS cheese plant, the Lubbock, TX cheese plant, and the Pasco, WA plant, along with numerous other smaller expansions are expected in 2024. States with friendlier land permitting and favorable business climates have seen the majority of growth, with Texas, Kansas, Idaho, South Dakota leading the way. It is critical that U.S. dairy exports continue their upward trajectory in the wake of these capacity expansions. Europe and New Zealand are facing major production hurdles in the long-term due to climate initiatives and limited land capacity, potentially opening the door for the U.S. to be a primary supplier in global dairy markets.
Dr. Marin Bozic is the founder and CEO of Bozic LLC, a global provider of technology solutions for commodity markets analytics and designer of three major livestock insurance programs in the United States - Dairy Revenue Protection, Livestock Gross Margin and Livestock Risk Protection. Dr. Bozic also currently serves on faculty in the Department of Applied Economics at the University of Minnesota. Marin’s research program covers dairy markets and policy and livestock risk management. Dr. Bozic is a board advisor to Edge Dairy Farmer Cooperative and a nationally popular consultant and speaker on economics of dairy markets and policy issues.
Brian Walton is an economist and research specialist with Bozic LLC. Brian’s research specializes in data analysis, consulting, and risk management in the dairy and grain sectors. Prior to joining the company, Brian worked at IHS Markit as a feed ingredients and dairy market analyst. Brian earned his undergraduate degree from the University of Minnesota in applied economics.
Editor: Chris Laughton
Contributors: Dr. Marin Bozic and Brian Walton
View previous editions of the KEP
Farm Credit East Disclaimer: The information provided in this communication/newsletter is not intended to be investment, tax, or legal advice and should not be relied upon by recipients for such purposes. Farm Credit East does not make any representation or warranty regarding the content, and disclaims any responsibility for the information, materials, third-party opinions, and data included in this report. In no event will Farm Credit East be liable for any decision made or actions taken by any person or persons relying on the information contained in this report.
Tags: ag economy, dairy
- Share this post on


