October 31, 2023
Farm Credit East Knowledge Exchange Industry Snapshots
Volume 17, Issue 11
November 2023
The National Economy
Overall GDP growth is projected to slow in the fourth quarter, and perhaps experience a shallow recession in early 2024, before recovering later in the year. While the U.S. economy has thus far proven remarkably resilient, the impact of a slowing global economy and numerous interest rate hikes are building headwinds for U.S. economic growth. Forecasts suggest that real (inflation-adjusted) GDP growth for 2023 will come in at 2.1-2.3% and decline to +0.8-1.5% in 2024. While a slowing economy may bring some leaner times for Americans, it is generally welcome news for the Federal Reserve, which has hiked rates 11 times since March 2022, in an effort to fight persistent inflation. These rate hikes have, in large part, had the intended effect, which is to cool the economy and lower inflation, yet avoid significant increases in unemployment.We have seen a marked slowdown in inflation, as the rate of price increases has declined from a peak of over 9% in June 2022, to 3.7% in August (year-over-year). While this reduction in price hikes is welcome news, it’s worth noting that prices are still rising, just not as quickly as they were in the recent past. Falling energy prices are a big part of this slowdown, which is good news, but masks the impact of price increases in other goods and services. For agriculture, this means that while farmers may be paying a little less for energy and fertilizer than they did last year, other costs are likely to remain elevated or increase further. The job market remains robust, with 336,000 jobs added in October, and an unemployment of 3.8%. This may give the Federal Reserve license to raise rates again in November and maintain higher rates for a longer period of time if inflation remains elevated.
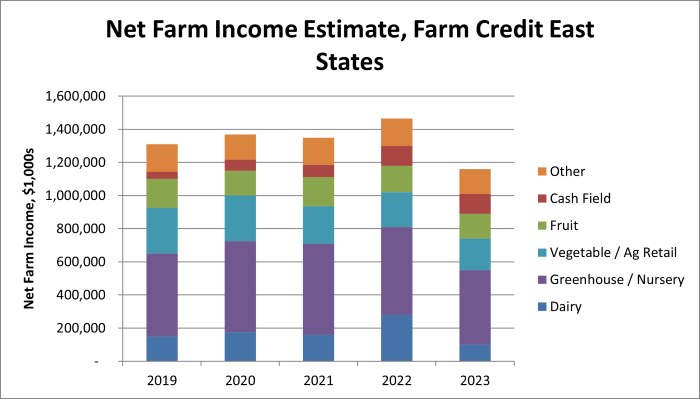
Net Farm Income Projection
Dairy Industry Snapshot
|
Avg. Price per Cwt. |
2021 |
2022 | 2023 June Forecast | 2023 October Forecast | 2024 October Forecast |
|
Boston Blend Price1 |
17.84 |
24.96 | 20.07 | 19.78 | 19.98 |
|
Avg. WNY Blend2 |
16.87 |
23.92 |
18.84 | 19.04 | N/A |
|
USDA All-Milk Price3 |
18.53 |
25.34 |
19.95 | 20.40 | 20.30 |
- August U.S. milk production decreased 0.3% from August 2022. The national dairy herd decreased by 15,000 head from the prior year, production per cow was flat.
- On a state-by-state basis, in August, there were Y-O-Y increases in production in some major producing states, including, Idaho (1.0%), Michigan (3.7%), and Wisconsin (1.2%). Notably, California (-3.7%), Texas (-3.2%) and New Mexico (-8.0%) showed declines. In the Northeast, New York (3.8%) Pennsylvania (0.5%), and Vermont (0.9%) had increases.4
- Milk prices have declined considerably from their highs in 2022. Boston Blend price averaged $20.17 in August, down substantially from the peak of $26.36 in 2022. Prices are expected to run in the low $20’s for the rest of 2023, and average $19.78 for the year.
- Input costs have risen, tightening margins for dairy producers. Labor, feed and other costs have risen significantly over the last two years, and while milk prices have declined significantly, input costs have generally remained elevated. While many producers entered 2023 in a good cash position, they are likely working through their savings to cover increased costs.
Cash Field Industry Snapshot
USDA Crop Forecast:
| National: | 2021/22 | 2022/23 | 2023/24 F |
| Corn Area Harvested (Mil. Acres) | 85.3 | 79.2 | 87.1 |
| Corn Yield/Acre (bu.) | 176.7 | 173.3 | 173.8 |
| Corn Price ($/bu.) | $6.00 | $6.60 | $4.90 |
| Soybeans Area Harvested (Mil. Acres) | 86.3 | 86.3 | 82.8 |
| Soybean Yield/Acre | 51.7 | 49.5 | 50.1 |
| Soybean Price ($/bu.) | $13.30 | $14.20 | $12.90 |
Source: USDA WASDE
USDA Crop Condition - 18 survey states:
| % Good or Excellent | As-of: Sep 25 | Previous Week | Previous Year |
| National Corn | 53% | 51% | 52% |
| National Soybeans | 50% | 52% | 55% |
| NY Corn | 80% | 81% | 44% |
| NY Soybeans | 70% | 70% | 56% |
Source: USDA NASS
- Prices for grains and oilseeds have declined from last year, with September 2023 corn futures trading at $5.56/bu, and August soybean futures at $13.95/bu.5
- Fertilizer availability has improved, and prices have fallen significantly, although they generally remain higher than the 5-year average, depending on the type of nutrients.
- Severe drought in the Midwest could boost prices for major row crops come harvest time, but it is too early to tell what the ultimate impact on yields will be.
Fruit Industry Snapshot
Tree Fruit
- USDA estimates New York’s apple crop at 26.2 million bushels, 12.8% below the 5-year average. Washington state’s crop is estimated at 159.5 million bushels, 13 million greater than last year, but still slightly below the 5-year average. Most states are estimating a crop slightly below the 5-year average, with the exception of Michigan, which, while below last year’s record, is estimated to come in nearly 30% above their 5-year average harvest.
- Late spring frosts negatively affected many tree fruit growers, although the impact was highly variable. Some New England growers reported losing most of their crop for 2023. This was particularly devastating for PYO growers, where the apple harvest drives fall traffic to their stands.
Small Fruit
- New Jersey blueberries showed strong yields early on, but heavy rains led to soft, lower-quality fruit later in the season for some growers. Some brokers were rejecting fruit due to splitting and quality issues. The late frosts that hit region impacted many growers of small fruit as well, particularly in New England, although the damage was inconsistent due to localized weather conditions.
Wine/Craft Beverage
- Reports of 2023 wine sales continue to be somewhat lackluster, and lag behind the stellar 2020 and 2021 figures. However, this is more of a “return to baseline” after the COVID surge, rather than a downturn from longer-term trends.
- There was a major freeze in late spring in several parts of New York and New England that damaged buds on grape vines. Yields are expected to be down from last year, but not as much as originally thought.
Cranberries
- It was a tough frost season, followed by an excessively wet period during bloom. Ultimately yields were off a little, but the quality was higher than usual. Overall balanced out in terms of the marketable crop. Pricing is stable to down slightly from last year.
Additional Industry Snapshots:
1 Agri-Mark Price Forecast
2 Upstate Niagara Price Forecast
3 USDA World Agricultural Supply and Demand Estimate (WASDE)
4 USDA NASS Milk Production Report
5 CBOT Futures
Editor: Chris Laughton
Contributors: Tom Cosgrove and Chris Laughton
View previous editions of the KEP
Farm Credit East Disclaimer: The information provided in this communication/newsletter is not intended to be investment, tax, or legal advice and should not be relied upon by recipients for such purposes. Farm Credit East does not make any representation or warranty regarding the content, and disclaims any responsibility for the information, materials, third-party opinions, and data included in this report. In no event will Farm Credit East be liable for any decision made or actions taken by any person or persons relying on the information contained in this report.
Tags: ag expenses, dairy, apple, cash field, fruit, wine, timber, vegetable
- Share this post on


