December 8, 2023
Christmas Trees Bring Joy to Consumers, but Complicated Economics to the Region’s Growers; USMCA Trade Panel Rejects U.S. Complaint About Access to Canada’s Dairy Market
Volume 17, Issue 12
December 2023
Christmas Trees Bring Joy to Consumers, but Complicated Economics to the Region’s Growers
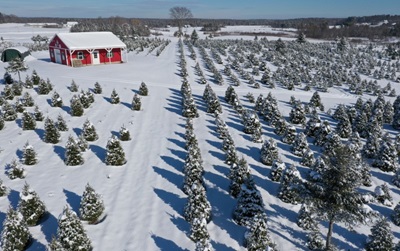
Christmas trees have been a holiday tradition for millennia and growing them in cultivation has been practiced for nearly as long. Today, thousands of Christmas tree farms dot the Northeast landscape, growing millions of trees on tens of thousands of acres. New York has by far the greatest number of Christmas tree growers, with New Jersey coming in second place, as seen in chart 1:
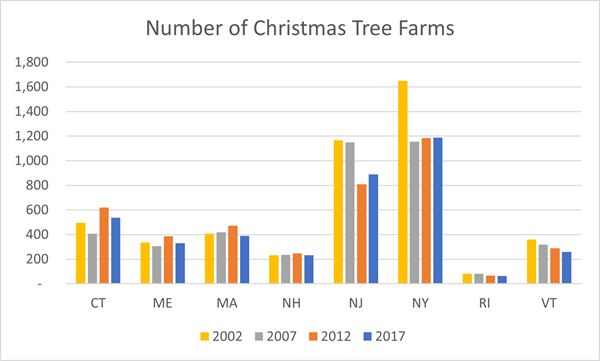
Source: USDA Census of Agriculture
The Northeast’s 3,894 Christmas tree growers harvested 924,949 trees, from 43,146 acres in 2017, according to the USDA’s Census of Agriculture.
But while Christmas trees may unquestionably bring one of the simple joys of the holiday season to the region’s consumers, their economics are far more complicated.
The first issue is that it takes a long time to grow a Christmas tree to marketable size. Depending on the species of evergreen in question, the average Christmas tree is about 10-12 years old. Typically, established farms plant back two or three trees for each one they harvest, creating a sustainable cycle for this very long-term crop. But for a grower just starting out, it can be quite a while until their first harvest, creating a formidable barrier to entry, which is why few farms start up each year, and many of those that do, grow Christmas trees as a side venture, in addition to other crops as their primary source of income.
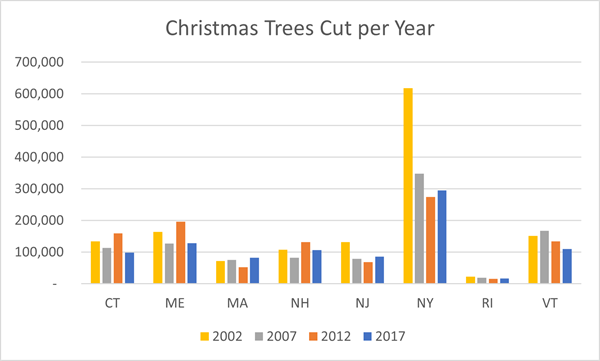
Source: USDA Census of Agriculture
During the growing cycle, the costs of producing a Christmas tree add up. A 3-year Fraser Fir seedling might run from $1.00-2.50 depending on where you buy them and how many, and while their unit cost might seem low, it adds up if you want to plant them by the thousands. Then there’s the labor to plant them, fertilize them, weed around them, spray them for insects and disease when needed, and shear them for eight years or so, until they reach marketable size. According to experts, over the production cycle, a single tree usually has 100-150 “touchpoints”, where a worker has sheared, sprayed, mowed around, or otherwise interacted with it, before harvest.
Not only do Christmas tree growers need to wait a long time to realize any revenue, the sales window is quite limited: Retail growers will tell you that it comes down to three big weekends, starting about the third week of November and going to about mid-December, depending on how the calendar falls. For wholesale, the window can be even more compressed – most tree sellers want their inventory in-hand by November 20-25.
With such a long growing cycle, accounting for unit production costs can be quite difficult.
But to truly know whether a grower is making or losing money on a given tree, they would need to accurately track the costs of producing that tree, starting with the planting cost, annual maintenance, and harvest, as well as the cumulative cost of the field space to grow it. Due to this complexity, few growers truly “enterprise” their production costs, choosing instead to rely on an annual profit-or-loss equation, comparing their revenue to their annual costs of planting, maintenance, and sales.
The industry has largely sorted out into two broad categories: Larger growers who serve wholesale markets, and focus on efficient production at scale, and smaller growers, who market direct-to-consumer, usually with added business ventures or product lines, such as additional holiday décor and activities, seasonal activities such as sleigh or hayrides, hosting events, focusing on selling the complete experience of the farm. As might be expected, the proprietors of Christmas tree farms range from business-minded entrepreneurs, to many who do it for the “holiday magic” or lifestyle purposes, often supplementing their venture with off-farm income or retirement savings.
One of the most challenging aspects of running a Christmas tree farm is the long-range planning needed. This spring, growers will be lining out trees for the 2031 harvest. Will nature provide enough rainfall? Will an invasive insect pest come for the trees? Will there be enough labor to maintain and care for the trees? And perhaps most importantly, will the 2031 consumer still want a live Christmas tree – and be willing to pay enough for it to keep the farm in business?
That last question keeps some tree growers up at night – Artificial trees continue to gain market share each year. In 2014, real trees outsold artificial trees by about 2-to-1. By 2022, artificial trees had captured nearly 60% of the market.
As a result, there have been structural changes in the Christmas tree industry in the Northeast. In 2002, there were some 4,700 tree growers in the 8-state region. By 2017, that number had declined to just under 3,900. Subsequently, the number of Christmas trees locally harvested has fallen by about one-third, from 1.4 million to 925,000, or about $30 million in revenue. Nationwide, including imports, about 25-30 million real Christmas trees are sold each year, generating approximately $700 million in revenue.
Still, when the holiday season rolls around, for those direct-to-consumer Christmas tree farms, demand remains robust. We can thank the growers that they had the foresight, ambition, and considerable patience to have planted a seedling back in 2014 or 2015 so we can cut it down this year.

USMCA Trade Panel Rejects U.S. Complaint About Access to Canada’s Dairy Market
The Issue
Under the United States-Mexico-Canada Agreement treaty (USMCA), Canada committed to allowing increased imports of dairy products from the United States. The dispute hinges on tariff-rate quotas (TRQs) that were part of the agreement. TRQs apply a reduced rate of duties to an in-quota quantity of imports and a higher rate to imports above quota.
Under the USMCA, Canada has the right to maintain 14 TRQs on the following dairy products: milk, cream, skim milk powder, butter and cream powder, industrial cheeses, cheeses of all types, milk powders, concentrated or condensed milk, yogurt and buttermilk, powdered buttermilk, whey powder, products consisting of natural milk constituents, ice cream and ice cream mixes, and other dairy.
In a 2022 dispute, the United States argued that, in notices to importers Canada published in June and October 2020 and May 2021 for dairy TRQs, Canada set aside and reserved a percentage of the quota for processors and for so-called “further processors”, contrary to Canada’s USMCA commitments. As a result of this restriction, Canada undermined the value of its dairy TRQs for U.S. farmers and exporters by limiting access to in-quota quantities negotiated under the Agreement.1
The United States prevailed in this complaint, and Canada subsequently updated its TRQ measures, but the U.S. countered that the revised TRQ allocation measures still posed “undue restraint” on U.S. dairy exporters in the Canadian market.
The Decision and Reaction
On November 24, the USMCA Dispute Panel determined that Canada’s updated TRQ measures satisfied its obligations under the USMCA.
Needless to say, U.S. government officials and dairy organizations were disappointed in the ruling. Tom Vilsack, U.S. Secretary of Agriculture commented, “The United States won the first USMCA case on Canada’s dairy TRQ allocation system with the ultimate goal of securing fair market access for U.S. dairy farmers, workers, processors, and exporters. Although we are disappointed in the outcome of this second case, we brought this case to refine and expand upon our win in the first case. We will continue to voice deep concerns about Canada’s system. We remain focused on securing the market access we believe Canada committed to under the USMCA and we will continue exploring all avenues available to achieve that goal.”
Jim Mulhern, President and CEO of the National Milk Producers Federation said, “It is profoundly disappointing that the dispute settlement panel has ruled in favor of obstruction of trade rather than trade facilitation. Despite this independent panel’s adverse ruling, we’d like to thank the Biden Administration and the many members of Congress who supported us for their tireless pursuit of justice for America’s dairy sector. We urge Ambassador Tai and Secretary Vilsack to look at all available options to ensure that Canada stops playing games and respects what was negotiated.”
Canada, however, welcomed the decision, with Trade Minister Mary Ng stating, “[We are] very pleased with the dispute settlement panel's findings, with all outcomes clearly in favour of Canada,"
The Path Forward
While there is no appeal process for USMCA dispute settlement panel decisions, the United States is sure to challenge Canada on dairy market access in the future. Despite significant trade restrictions, Canada is a major trading partner with the United States in dairy, ranking #2 by value of imports, after Mexico.
|
Export Destination |
2018 Value, ($millions) |
2019 |
2020 |
2021 |
2022 |
|
World Total |
5,479 |
5,914 |
6,448 |
7,596 |
9,545 |
|
1. Mexico |
1,375 |
1,526 |
1,401 |
1,786 |
2,443 |
|
2. Canada |
700 |
728 |
736 |
855 |
1,030 |
|
3. China |
498 |
373 |
539 |
701 |
803 |
|
4. Philippines |
247 |
273 |
409 |
424 |
582 |
|
5. South Korea |
290 |
330 |
370 |
420 |
569 |
Source: USDA Foreign Agricultural Service
Canada has a highly controlled dairy market, with domestic producers operating under a strict quota system and tight restrictions on imports. As a result, Canadian dairy farmers receive higher prices for their milk, and consumers pay higher prices for dairy products. Dairy trade was a major negotiation point in the USMCA development process with farmers in both Canada and the United States watching the issue closely.
1 Office of the United States Trade Representative
Editor: Chris Laughton
Contributors: Tom Cosgrove and Chris Laughton
View previous editions of the KEP
Farm Credit East Disclaimer: The information provided in this communication/newsletter is not intended to be investment, tax, or legal advice and should not be relied upon by recipients for such purposes. Farm Credit East does not make any representation or warranty regarding the content, and disclaims any responsibility for the information, materials, third-party opinions, and data included in this report. In no event will Farm Credit East be liable for any decision made or actions taken by any person or persons relying on the information contained in this report.
Tags: ag expenses, dairy, apple, cash field, fruit, wine, timber, vegetable
- Share this post on


