December 9, 2021
Inflation and Snarled Supply Chains: Is There Relief in Sight?
Contents
Volume 15, Issue 12
December 2021
Inflation and Snarled Supply Chains: Is There Relief in Sight?
When we wrote about inflation and supply chain disruptions earlier this year, it was unclear whether the situation would improve or continue to deteriorate. Unfortunately, since then, things have generally gotten worse.
While official economy-wide statistics are remarkable enough, they somewhat mask the impact of individual product shortages and price increases. Anecdotal stories abound of scarce supplies and costs that have risen sharply over the past year.
What’s going on?
So what is causing this “perfect storm” of inflation, shortages and general scarcity that seems to be affecting our entire economy? The story of what’s happening this year has everything to do with what happened last year.
As is often the case, it’s complicated — and the story goes deeper than just congestion at container ports, although that’s part of it. To get to the root of our current crisis, we need to go back to the beginning of 2020, and maybe even before. And just as it took time to get where we are, it’s going to take time to get out of it.
The United States, and indeed much of the globe, began 2020 with a transportation network that was already stretched thin. Years of underinvestment in key logistics facilities, such as ports, rail and trucking fleets, meant that our transportation resources were barely adequate to meet the needs of a growing global economy.
Then came COVID-19, which turned our economy upside down virtually overnight. We saw major parts of the economy shut down or severely restricted. Restaurants, retail stores and entertainment venues closed. In the manufacturing sector, production in factories, meatpacking plants and other businesses was curtailed as companies saw decreased demand for their products and/or struggled to maintain their workforces, keep employees healthy, and keep product flowing from producer to consumer.
It may seem overly basic, but remember that prices for most goods and services are generally determined by supply and demand. If supply remains steady, and demand declines, then prices usually go down. That’s what we saw to some degree in the first half of 2020. Certainly, it was the case with energy markets. As things shut down, oil became a glut on the market and briefly went negative in futures markets. Gasoline hit a low of less than $1.79 per gallon as people stayed home and limited driving.1
Later in the year, as the U.S. economy gradually opened in late 2020 and into 2021, demand bounced back for many products, and in many cases, bounced back faster than producers could keep up. Meanwhile, suppliers faced a hangover of reduced capacity — some of it intentional as businesses had scaled back during shutdowns, and some of it unintentional as employees left the workforce in large numbers and businesses struggled to hire and retain staff.
So back to our Econ 101 Supply-Demand chart: In 2021, with supply down and demand surging, it’s no surprise that prices are rising.
What’s holding things back?
In many cases, the effects of COVID-19 persist, and have limited producers’ ability to scale up to meet resurgent demand. A big factor is staffing: In the early stages of the COVID-19 pandemic, the U.S. economy shed more than 22 million jobs in March and April 2020. This unprecedented and rapid contraction in the labor market caused unemployment to jump from 4.4% in March 2020 to 14.8% in April. And basically, since May 2020, employers have been struggling to get those employees back.
There are a number of factors to explain why it has been so difficult. Initially, enhanced and extended unemployment benefits may have been a disincentive for employees to return to work, but as some of the enhanced benefits have expired, firms are still struggling to find employees. Some workers have been reluctant to return to work because of fear of COVID-19. Others had difficulty caring for children unable to return to school or other members of their family. And a number of workers simply decided that they didn’t want to work in the jobs available for the wages that were being offered.
The Labor Force Participation Rate — the percent of the population over 16 that is either working or seeking employment — was at 63.3% in February 2020. After an initial drop to 60.2% in April, it has since stabilized at about 61.5%. While that drop of 1.8% of the population may not sound like a lot, it means that about 5 million Americans have dropped out of the workforce.2
As the economy returns to pre-COVID-19 levels, it’s having to do so with 5 million fewer workers. So, it’s not your imagination — you really are seeing “Help Wanted” signs everywhere. This shortage of workers extends to all parts of the economy and is limiting the ability of many companies to meet demand. Some businesses have had to turn away customers or limit their operations as they try to make do with fewer workers. When suppliers of raw materials or transportation services face these limitations, the effects ripple throughout the economy.
And it’s not just the United States. Across the globe, many countries have been even more severely affected by COVID-19. Several Asian countries are dealing with significant new outbreaks of the virus, which has affected both factory output as well as shipping operations. The global nature of today’s supply chains means that if a factory in China can’t keep up with demand for computer chips, a factory in Europe might have to shut down, which might affect parts availability for an American equipment dealer, which means that your tractor may not get fixed for a while.
An Atypical Recession: An Atypical Recovery
2020 was an unusual year for the economy, to put it mildly. What we had, effectively, was a significant recession that was artificially imposed on the economy by external factors — namely a virus. As a result, the U.S. economy shrank by an annualized rate of -33.4% in the second quarter of 2020.3
Fearful of an economic disaster, the federal government pumped an unprecedented amount of money into the U.S. economy in an effort to prevent an extended and severe slowdown — and it worked — perhaps too well in some respects. Between programs like the Paycheck Protection Program, the Coronavirus Food Assistance Program and individual stimulus payments, federal spending ballooned from $4.4 trillion in FY 2019, to $6.6 trillion in FY 2020, and $7.2 trillion in FY 2021 — an increase of $2.8 trillion from 2019 to 2021. The intent was to shore up personal income and consumer demand to ward off an extended recession. The result was the economy had an extra $2.8 trillion, or more than 10% of total GDP, to spend, and fewer people and supplies to meet that additional demand.4
In a more typical recession, we usually see a broad and gradual decline in demand for goods and services across the economy. People may get laid off, resulting in less consumer spending and companies see a slowdown in business. As the economy slowly recovers, business activity picks up, people go back to work and better economic times return.
With the COVID-19 recession, the economy sharply and abruptly contracted. A significant boost in the form of stimulus spending caused a rapid resurgence in purchasing of goods and services from consumers flush with cash and pent-up demand. This strained the capacity of businesses still struggling due to the pandemic, and moreover, with a diminished workforce and a snarled global supply chain.
So where does that leave us?
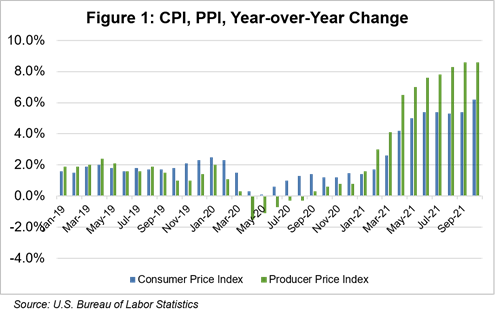
We’re currently experiencing rapid inflation at both the producer and consumer level. As can be seen in figure 1, this inflation is being felt more at the producer level than at the consumer level. A big part of this relates to energy costs, which have dramatically risen as the global economy rebounds faster than energy production. Consumer energy costs, mainly gasoline and natural gas, have surged by 1/3 over this time last year.5 While energy leads the pack in terms of cost inflation, many other categories are significantly higher as well.
Beyond energy, which affects everyone, there are several agricultural-specific categories that have seen significant cost increases and/or supply shocks. Fertilizer costs have risen dramatically. While prices vary widely by type of fertilizer and location, average prices have increased anywhere from 54-163% since spring 2021.6 Other crop and livestock production inputs have shown similar increases and widespread supply shortages.
So, while the price increases we’re seeing currently make sense given the unusual economic circumstances, all eyes are on the coming 12-18 months.
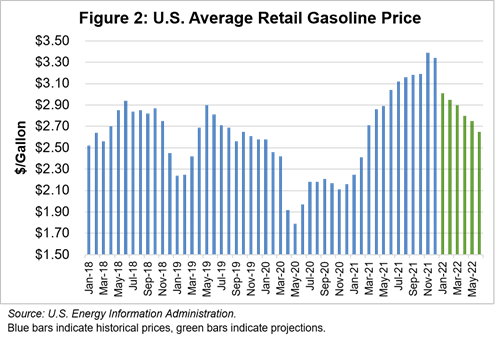
Indications are already emerging that the rate of inflation is going to slow, and that while most of the price increases we’ve experienced over the last 6-12 months are here to stay, some prices, most notably energy costs, may decline somewhat in the coming year. Figure 2 shows average U.S. retail gasoline prices. Note the depressed price levels in 2020, the rise in prices this year, and the 2022 forecast.
Looking ahead, most economists believe that inflation will eventually retreat to a baseline of 2-3%, but forecasts differ on how long that might take. According to a survey of economists by Bloomberg, the consensus forecast is for CPI inflation to come in at an annualized rate of 5.8% for Q4 2021, 5.5% for Q1 2022, 4.0% for Q2 2022, and 3.1% for Q3 2022.7 The big wildcard in the forecast is what will happen in labor markets, and how much inflationary pressure that will put on the overall economy. For now, we’ll have to stay tuned.
1 U.S. Energy Information Administration
2 U.S. Bureau of Labor Statistics
3 U.S. Bureau of Economic Analysis
4 U.S. Department of the Treasury, USASpending.gov
5 U.S. Bureau of Labor Statistics
6 DTN/Progressive Farmer
7 “Economists Boost U.S. Inflation Forecasts Through End of 2022,” Bloomberg.com, November 12, 2021.
Editor: Chris Laughton
Contributors: Tom Cosgrove and Chris Laughton
View previous editions of the KEP
Farm Credit East Disclaimer: The information provided in this communication/newsletter is not intended to be investment, tax, or legal advice and should not be relied upon by recipients for such purposes. Farm Credit East does not make any representation or warranty regarding the content, and disclaims any responsibility for the information, materials, third-party opinions, and data included in this report. In no event will Farm Credit East be liable for any decision made or actions taken by any person or persons relying on the information contained in this report.
Tags: outlook, economy, labor, trade, trade
- Share this post on


