March 11, 2024

U.S. Apple Industry Reckons with High Production
Contributed by Chris Gerlach, Director of Industry Analytics, USApple
At this time last year, the industry was preoccupied with the question of what happens when the U.S. apple industry produces at or near capacity? While the official numbers are not yet in, it seems as though that question is now being answered.
The following report utilizes data from the U.S. Apple Association’s monthly storage survey (USAppleTracker) along with publicly available data on movement, trade and prices to unpack the season to date and see how markets are reacting to, what is by all accounts, a banner year.
Early-Season Storages
As of November 1, 2023, there were 191 million bushels (42 pounds per bushel) of apples in U.S. storages. Of that figure, 140 million bushels (73%) were destined for the fresh market while 51 million bushels (27%) were designated as processing apples.
This represents a 32% year-over-year increase and is the highest ever recorded November storage volume taking the spot from the 2014/15 season. A decade ago, the fresh holdings figure was slightly larger at 144 million bushels, but processors were significantly lower at 44 million bushels.
At a state level, Washington reported a nearly 40% jump in November storages to 152 million bushels. This one-year, 42-million-bushel increase in the state’s holdings is roughly equivalent to the total combined annual production of Michigan and Pennsylvania. Washington accounted for 90% of the total year-over-year growth.
New York also saw its November storage volumes jump by around 25% to 15 million bushels, accounting for much of the remaining growth.
Michigan, with 12 million bushels, was down 6% in November – nearly a million bushels below last year’s holdings. Although down, this still represents a significant crop for the state as holdings were 26% above the November five-year averages.
At a varietal level, November Honeycrisp holdings increased by 62% to 30 million bushels, taking the top spot from Gala for the first time. Gala storages also grew, increasing to 29 million bushels, 12% up from last year.
Rounding out the top five most abundant varieties in November were Red Delicious (26 million bushels), Granny Smith (23 million bushels) and Fuji (18 million bushels) all up considerably year over year. The Other Varieties category that includes many of the proprietary, managed brands was up 10% from last November to 17 million bushels.
From Storages to Implied Production
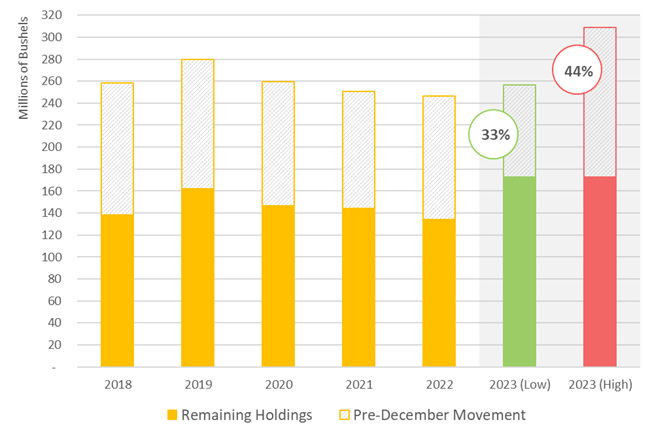
By the December datapoint, it is assumed that all the apples that will be harvested have made their way into U.S. apple storages and the USAppleTracker survey. The calculation to determine total production is then simply: December storages plus pre-December movement (for the current year’s crop). Unfortunately, those movement data are not yet available, so we use estimates.
Over the last five seasons, December storage volumes were around 56% of total final U.S. Department of Agriculture (USDA) production values. Alternatively stated, on average, 44% of U.S. apples produced “move” prior to December 1st in any given year.
In August 2023, USApple estimated total production at 256 million bushels.
If that production estimate is correct – and we know that there were 173 million bushels in U.S. storages as of December 1 – then it would imply that there was extraordinarily slow pre-December movement. That is, only 33% of total production would have “moved” prior to the December datapoint versus the 44% five-year average.
If that production estimate is not correct – and pre-December movement is closer to the five-year average – then 173 million bushels in December implies a total crop somewhere close to 310 million bushels. It is likely that both are true to some extent and the actual production number falls somewhere in between.
USAppleTracker December Storage History & Implied 2023 Production
Sources: USApple; USDA, NASS
USDA Fresh Apple Movement
USApple’s movement dataset is defined as the difference between one month’s storages and the next. With surveys starting in November and running until June, that leaves only seven months of datapoints.
The USDA’s Agricultural Marketing Service (AMS) maintains a movement dataset year-round. These data have the benefit of being consistent from month-to-month and year-to-year. However, users should be aware that this dataset represents only fresh apples, they are inclusive of imports/exports and there are no estimations.
For those reasons, the sum of the AMS movement data is regularly 5% to 25% below the USDA’s own fresh apple production levels from the National Agricultural Statistics Service (NASS). The export movement is also regularly 10% to 25% below USDA’s Foreign Agricultural Service (FAS) fresh apple export totals.
As noted above, despite not capturing 100% of apple movement, the AMS dataset is useful as a means of drawing comparisons between seasons or between months within a season.
In a big year like the one experienced a decade ago, the season needs to get up and running quickly with significant August and September movement. During the brunt of the season from October to May, movement needs to remain consistently high – above 14 million bushels per month. Sellers may also be required to continue to move a prior season’s apples well into the current season (August to December).
AMS Fresh Apple Movement: 2014/15 vs. 2023/24 Season-To-Date
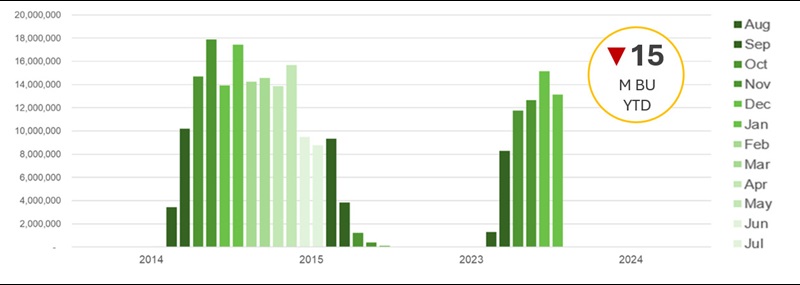
Sources: USApple; USDA, AMS
As shown above, movement for the current season to date is around 15 million bushels behind the 2014/15 movement through January. This “lost month” of sales will be difficult to make up in the second half of this season and may require selling deep into the 2024/25 season, provided the storage space and bins are available.
U.S. Fresh Apple Trade
Apple consumption in the U.S. has remained relatively flat over the past ten years, so the drop in movement can be traced directly to declining fresh apple exports.
During the 2014/15 season, exports reached an all-time high of 54 million bushels. For comparison, fresh apple exports last season were only 32 million bushels – a decrease of 41% or 22 million bushels.
As detailed in the figure below, so far this season, fresh apple exports are up considerably compared to last year – growing by around 45% through December. Unfortunately, exports this season-to-date are still below that high-water mark set a decade ago – lower by around 6%.
U.S. Fresh Apple Exports: Select Seasons
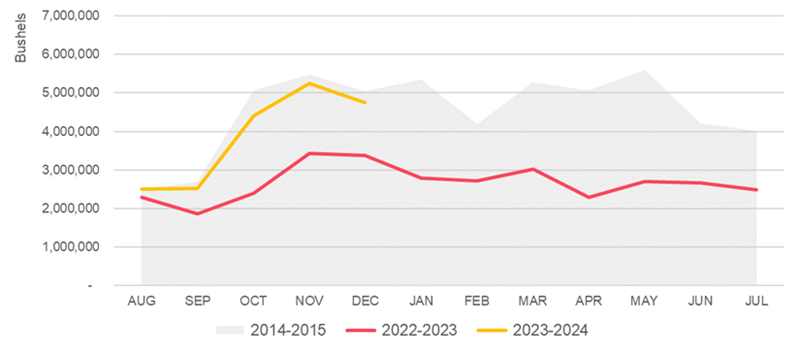
Sources: USApple; USDA, FAS
Of course, if we are discussing domestic supply, it is important to consider imports as well even if they are relatively small. Going into the 2014/15 season, fresh apple imports were around 10 million bushels. In the following season when there were still plenty of domestic apples left in U.S. storages, imports fell by 32% to around 7 million bushels.
Fresh apple imports have continued to fall over the decade. So far this season, imports are around half of what they were during the 2014/15 season. Interestingly, however, the typical import pattern has shifted somewhat. Ten years ago, fresh apple imports basically fell to zero in September and didn’t pick up again until March.
In more recent years, imports seem to be more evenly spread across the season with at least some volume being brought in past the August timeframe – well past the point where we know if there are enough U.S. apples to satisfy domestic demand.
U.S. Fresh Apple Prices
The market reacted quickly to this increase in supply. From July to December 2023, the consumer price index (CPI) for fresh apples, a proxy for retail prices, fell by 9%. In the 2014/15 season, prices ultimately fell by around 12% (see figure below).
U.S. Fresh Apple CPI: 2014-2023
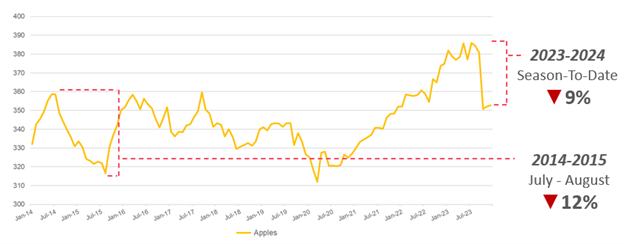
Sources: USApple; USDOL, BLS
The deflation apples have experienced thus far this season is notable as the U.S. economy is generally going through an inflationary period. The prices for all fresh fruit, for example, were up by 2% in the second half of 2023. As apples become less expensive relative to substitute goods, retailers are hoping to incentivize additional consumption and drive volume. The extent to which that strategy has been successful is unclear.
It is clear, however, that the 9% discount for consumers is not equivalent to the drop in prices that the growers are receiving. Across the board, grower prices (also known as farm-gate or shipping-point prices) are down by considerably higher margins. The figure below highlights the season-to-date farm-gate prices for just a few of the top varieties.
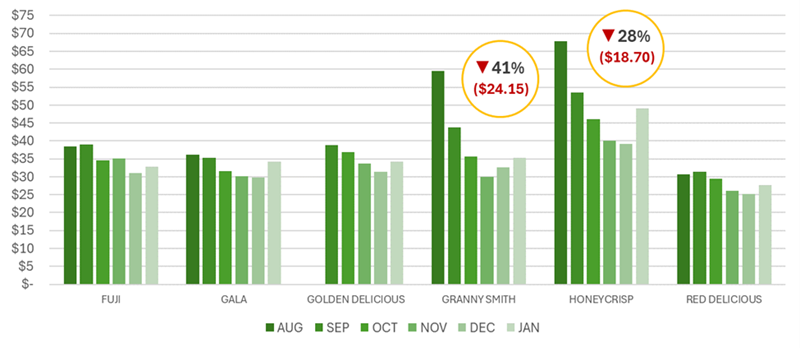
U.S. Shipping-Point Prices: Select Varieties, 2023 Season-To-Date
Sources: USApple; USDA, AMS
As the data show, prices rebounded somewhat in January 2024, but were still well below August values. In two of the more dramatic examples, Honeycrisp grower prices were off by 28%, down $18.70 per carton tray pack and Granny Smith prices were down $24.15 per carton tray pack (-41%) through January.
These price levels are not sustainable. That is, in many cases, the costs of producing apples are now higher than the revenues received for that fruit. The primary factor driving those higher costs is labor.
In 2014, the Adverse Effect Wage Rate, the government-mandated wage rate for H-2A temporary agricultural labor, for apple producing states was $11.20 (not adjusted for inflation). That wage rate now stands at $17.19 an hour – an increase of 54% or $6 per hour.
U.S. Apple Markets Going Forward
Ten years ago, the U.S. apple industry put up a big production number and the market reacted accordingly. Since that time, the number of apple-bearing acres in the country has increased by 10% to around 363,000 acres (per the 2022 Census of Agriculture). Additionally, it can be assumed that the orchards that have been added during that period are generally of a higher density, leading to an increased yield per acre.
With that in mind, perhaps the U.S. apple industry did show some restraint during harvest this season, opting for single passes through orchards as opposed to the two or three passes that are typical. If that is the case, then we have not yet seen the full production capacity of U.S. apple growers, and that is probably a good thing.
Given that apple orchards are both expensive to plant and expected to last decades, it is unlikely that we will see a large-scale reduction in capacity. Rather, the industry must work to increase both domestic and international consumption of U.S. apples whenever possible. Unless and until that additional demand comes online, it will be critical that U.S. growers heed these lessons from the past and limit supply to a point where prices can justify the costs.
Editor: Chris Laughton
Contributors: Christopher Gerlach and Chris Laughton
View the 2023 Northeast Apple Industry Outlook
Farm Credit East Disclaimer: The information provided in this communication/newsletter is not intended to be investment, tax, or legal advice and should not be relied upon by recipients for such purposes. Farm Credit East does not make any representation or warranty regarding the content, and disclaims any responsibility for the information, materials, third-party opinions, and data included in this report. In no event will Farm Credit East be liable for any decision made or actions taken by any person or persons relying on the information contained in this report.
2024 Northeast Apple Industry Outlook Webinar
On Thursday, March 14, Chris Gerlach, USApple’s Director of Industry Analytics reviewed data on holdings, movement, trade, and prices to see how markets are reacting to, what is by all accounts, a banner year.

- Share this post on


