May 3, 2026
Dairy Markets Show Positive Trends
Volume 20, Issue 5
May 2026
Contributed by CoBank dairy lead economist Corey Geiger
After some rather sluggish dairy prices to start out the new year, margins to make milk have improved and that is one reason for a positive outlook. Another reason for optimism is strong consumer demand for protein and dairy wins two ways – protein found in milk and protein from beef sales. A third reason to be optimistic is new dairy plant investment continues to be announced this year and by my count, there is $13 billion of new capital investment in U.S. dairy plants and that will ensure a home for the growing milk supply.
While many indicators point upward, there are some reasons for caution. For starters, the EU continues to show strong growth in milk production with output being up 5% or more year-over-year from October 2025 through February 2026. That’s noteworthy growth for the world’s largest dairy product and ingredient exporter that’s 1.6 times the size of the U.S. dairy sector. Another reason for caution is the ongoing conflict in the Middle East that is making it extremely difficult to move products. That includes dairy products into, and fuel and fertilizer out of the region.
Butterfat growth remains strong
Many Middle East countries import over 90% of their food supply. For dairy, that includes a great deal of butterfat. Bringing this back to U.S. milk markets, our country has been a butterfat-deficit market for many decades. However, the tide has turned, and America may be structurally short on dairy protein and long on butterfat moving forward.
This will change how products and ingredients move in both domestic and export markets. We will balance product flows based on dairy protein production, and butterfat will need to find new markets, with the export market being a significant focus. This transition will create more market volatility, as we have already witnessed from August 2025 through March 2026.
Prior to the creation of the North American Free Trade Agreement in 1994 and the U.S. Dairy Export Council in 1995, the U.S. was largely a nonplayer on the dairy export stage. By 2011, the U.S. was exporting 16.5% of its milk production on a skim solids basis. In other words, the U.S. kept the skimmed off butterfat from the milk stream and sold the skim solids (largely in the form of protein and lactose) to customers around the world. In fact, the spread was so large between the product mix that exports measured on a milk fat basis were a meager 4.6% of U.S. milk production.
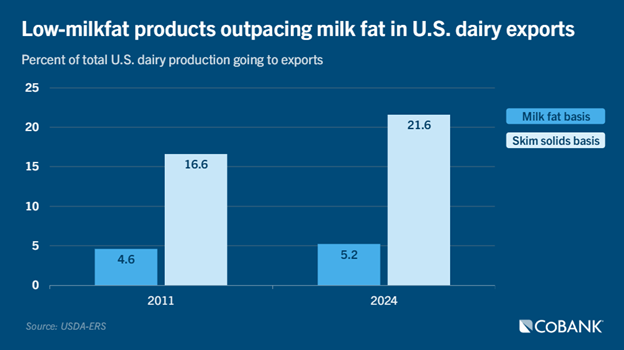
The story hadn’t changed much by 2024. That year, U.S. dairy processors exported 21.6% of America’s milk production on a skim solids basis. But exports on a milk-fat basis hardly budged, posting just 5.2% in exports even though total exports represented 17% of the nation’s total milk production. In other words, domestic consumers were buying nearly all of America’s butterfat production in the form of dairy products and little was available for export markets.
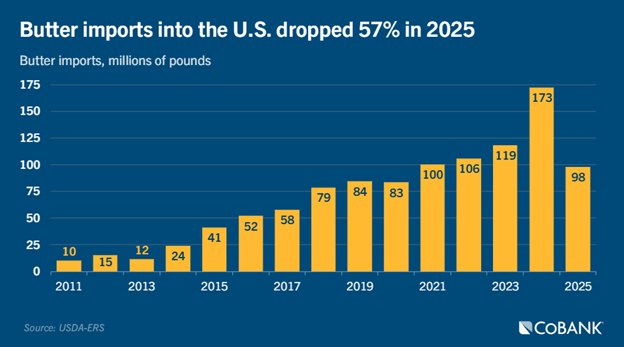
Not only were Americans buying domestic butterfat, but they also started buying more imported butter. In 2011, the U.S. imported 10 million pounds of butter. By 2021, butter imports grew 10-fold to reach 100 million pounds. With more demand from American consumers, butter imports grew another 72% to reach 173 million pounds of imported butter by 2024. With strong domestic butterfat production in 2025, butter imports fell 57% to 98 million pounds.
Along the way, U.S. multiple component pricing factors, via the Federal Milk Marketing Order system, gave stronger signals to produce more butterfat. As a result, butterfat percentages on farm went on a historic run, moving from 3.66% in 2010 to 4.29% in 2025. This growth stemmed from a combination of changes in feed rations and the influx of genetic change via artificial breeding programs and the new science of genomic predictions.
This rapid growth in butterfat eventually pushed the production pendulum in the opposite direction mid-year 2025 — long on butterfat and short on protein. Not only did production of products like cottage cheese, dairy nutritional shakes and Greek yogurt demand more protein and less fat, but butterfat production on a pounds basis also began growing by 5% to 6% in any given month by mid-year. That strong growth began outstripping domestic market demand to absorb farmgate butterfat production.
As a result, butter prices on the CME began to drop from $2.44 per pound on Aug. 1, 2025, to $1.50 per pound by mid-November just when butter sales typically would peak as the holiday season approached.
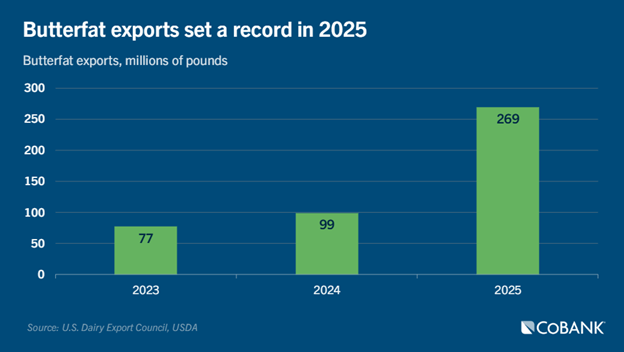
Spot butter prices have since improved to the $1.75 to $2 per pound range. Domestic market demand didn’t improve spot prices; export markets did. The U.S. exported an impressive 269 million pounds of butterfat and anhydrous milkfat in 2025, boosting total export volume 271% from the previous year. More importantly to balancing markets, 60% of those 269 million pounds of butterfat were exported in the second half of the year when the U.S. needed to move inventory.
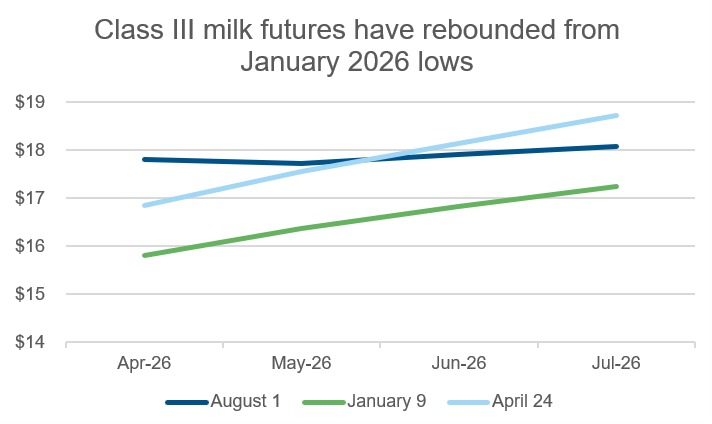
This huge increase in domestic butterfat production has created significant volatility in Class III cheese and whey markets, and an even greater downturn in Class IV butter and powder markets. In August 2025, Class III contracts for April 2026 to August 2026 milk traded between $17 to $18. In January, due to market pressures from butterfat, those same contracts traded between $15 and $17. Then with strong butterfat exports and other factors, April 24 CME futures nearly rebounded to pre-August levels with stronger prices seen in later months’ contracts.
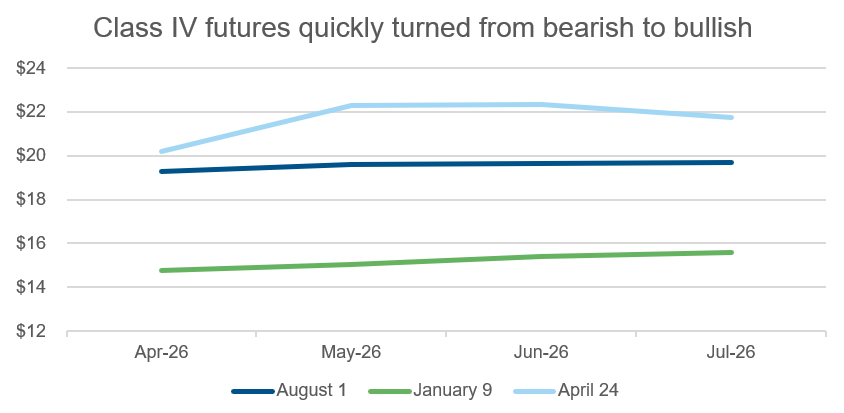
The situation was more dramatic in the Class IV space. In August 2025, all contracts for the March 2026 to July 2026 window traded above $19 per hundredweight. By January 9, 2026, those same contracts dropped to the $14 to $15 range. After the impact of strong butterfat
exports and the recent tightening nonfat dry milk market that sent prices to record highs, April to July 2026 CME Class IV futures climbed to pre-August 2025 trading levels and in some months those contracts traded close to or over $20.
Protein has become the most important consumer demand trend and that’s where the growing U.S. dairy cow herd comes into play as beef prices stand at record highs. That begs the question: how much larger will the U.S. dairy cow herd grow to reap rewards from beef-on-dairy calves and may that resulting growth in milk production cause an oversupply in the marketplace?
The U.S. dairy cow milking herd is at its largest in over 30 years at 9.621 million head in March. Compared to a year ago, the herd is 187,000 head (+1.9%) larger and produced about the same amount of milk per cow. However, these additional cows added to total milk production, which grew by 2.3%. March butterfat production grew 3.3% and protein pounds were up 3.6% reflecting feeding adjustments for lower butterfat prices in recent months.
Beef-on-dairy calves are one of the primary reasons to keep dairy cows longer in the herd, especially after notching a record $1,918 per head in mid-April. Recent visits by CoBank (Farm Credit East’s lending bank) staff to feedlots in Texas mentioned 15% to 20% of cattle on feed are beef-on-dairy animals. These crossbreds grow well in the feedlot and can weigh over 1,700 pounds before heading to the beef packer due to the larger frame provided by the dairy genetics. Strong interest in beef-on-dairy calves should continue given the U.S. beef cow herd is at the lowest level in 65 years. Plus, beef sales to consumers have shown 27 straight months of volume growth.
While the are many reasons for optimism, dairy markets are not out of the proverbial woods. The 2025 export year might have been even better had there not been geopolitical issues and tariffs making an impact. The largest catalyst supporting U.S. sales growth was lower cheese and butter prices compared to the world’s top two dairy exporters – the EU and New Zealand. Given this situation, dairy farmers and processors alike should consider hedging opportunities when market prices look favorable and cover expenses because small product movements could significantly move prices.
Risk Management Update: Protecting Margins in a Volatile Market
Contributed by Megan Clancy, Crop Growers Dairy & Livestock Risk Management Senior Advisor
Crop Growers is an equal opportunity provider.
As we move through the second half of the year, risk management remains a critical component of maintaining profitability in today’s dairy environment. While milk prices and feed costs continue to shift, protecting both core revenue and growing revenue streams, such as beef-on-dairy calves, has never been more important.
Livestock Risk Protection (LRP) continues to offer strong opportunities to lock in favorable calf prices. With cattle markets remaining historically strong, LRP allows producers to establish a price floor on calves. Current coverage prices range up to $1,500 per head. This protection is especially relevant as more dairy operations capitalize on beef genetics, making calves a meaningful and growing contributor to overall farm revenue.
On the milk side, Dairy Revenue Protection (DRP) remains a cornerstone risk management tool. With ongoing volatility in Class III and Class IV markets, DRP helps stabilize income and support more predictable cash flow. Notably, DRP delivered significant indemnity payments to producers in the first quarter. Since the beginning of the year, Class III and Class IV futures have increased by approximately $7.00/cwt, creating additional risk management opportunities for forward coverage. As milk prices have shifted higher, DRP participation for 2026 has increased, with approximately 30% of U.S. milk production covered already for Q3.
Finally, it’s important to remember that these programs are not static. Each year, particularly with updates that take effect on July 1, risk management tools continue to evolve and modernize to better meet the needs of today’s producers. Staying informed and working with a trusted advisor ensures you’re maximizing the value of the tools available.
Editor: Chris Laughton
Contributors: Corey Geiger, Lead Economist, Dairy, CoBank
View previous editions of the KEP
Farm Credit East Disclaimer: The information provided in this communication/newsletter is not intended to be investment, tax, or legal advice and should not be relied upon by recipients for such purposes. Farm Credit East does not make any representation or warranty regarding the content, and disclaims any responsibility for the information, materials, third-party opinions, and data included in this report. In no event will Farm Credit East be liable for any decision made or actions taken by any person or persons relying on the information contained in this report.
Tags: outlook, dairy, economy, risk management
- Share this post on


