April 1, 2026
2026 Apple Industry Outlook: U.S. Apple Industry Hits Latest Inflection Point
Volume 20, Issue 4
April 2026
Contributed by Chris Gerlach, Vice President, Insights & Analytics, USApple
A Ticking Clock
The U.S. apple industry is in uncharted territory. For two consecutive years, the price that many commercial growers have been getting for fresh apples has been less than the cost of their production. This trend is unsustainable in any industry, but it is particularly challenging in the agricultural sector where farmers are generally “asset rich” but “cash poor.”
As reserves run low, many growers will look to take on debt or bring in equity partners to secure the capital needed to farm another season. For some with the right locations, planting systems and varietal mixes, money may be available, though there may be additional strings attached. For others with older varieties in less-dense orchards and suboptimal locations, the expected return from apple sales may not be sufficient to justify reinvestment.
At this point, it is difficult to say how this will all play out and what the industry will look like once it has. In terms of timing, it is unlikely that this situation will be resolved quickly and will instead unfold gradually over the next several years.
Inflection Points
As the industry looks for ways to best to navigate the coming changes, it is instructive to look to the past and review how we got to this point. To that end, Figure 1 details the last 25 years of fresh apple movement and inflation-adjusted grower prices.
Figure 1: U.S. Fresh Apple Movement & Prices
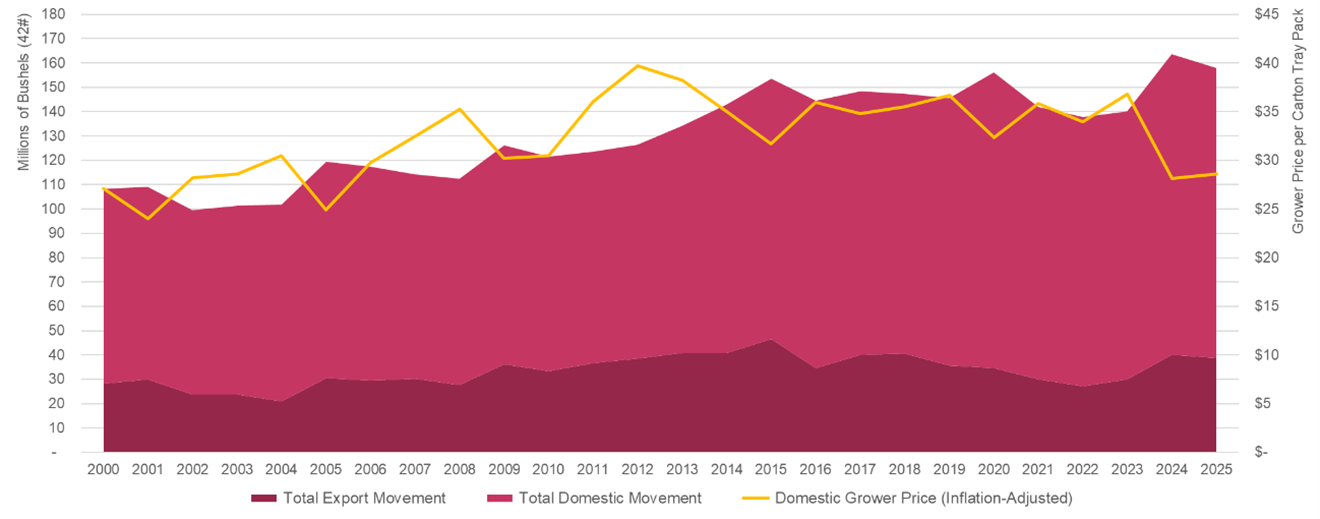
Note: This is a stacked area chart where total fresh apple movement is represented as the sum of domestic movement and exports.
Sources: USDA, AMS; USApple
Between 2000 and 2015, total fresh apple movement – the sum of domestic shipments and exports – was growing steadily, increasing from around 100 million bushels to more than 150 million bushels. It was during this period that U.S. apple exporters started to rapidly expand existing markets like Mexico and Canada and open new markets like India and Vietnam. Over those 15 years, exports grew by 66%, peaking in 2015 at around 47 million bushels, accounting for 30% of total fresh movement.1
During this growth period, the export markets effectively served as a pressure relief valve in years of above-average production. This can be seen in the corresponding peaks of the movement datasets in 2005, 2009 and 2015. These year-over-year surges in exports were generally accomplished with promotional pricing. Data from USDA’s Foreign Agriculture Service (FAS) shows that average inflation-adjusted export prices dropped between 10% and 15% in those years.
Of course, not all of that growth was absorbed by the export markets. During the 15-year stretch from 2000 to 2015, domestic fresh apple movement was also on the rise, increasing by 33%. Here too, surges in production were managed with discounted pricing as shown by the inverse relationship between spikes in movement and dips in domestic grower prices.
Despite these occasional and short-term adjustments, this period was marked by steadily rising prices, peaking in 2012, the year Michigan lost upwards of 90% of their crop to an early bloom and late frost. The $40 per box value shown in Figure 1 is, of course, an average of all the varieties tracked by USDA. When disaggregated, the data show that this trend of rising prices through 2012 was true for a number of the nation’s top varieties. The data also show the stark difference in value between newer varieties like Honeycrisp and older ones like Red Delicious (see Figure 2).
Figure 2: U.S. Fresh Apple Prices by Variety
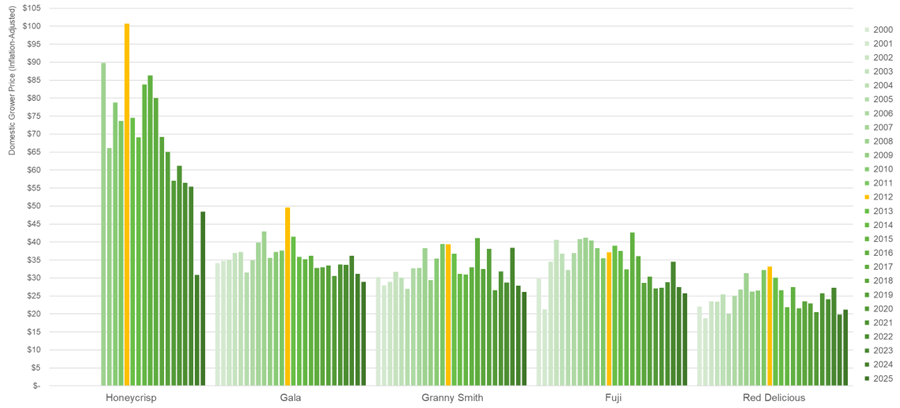
Note: USDA only began tracking Honeycrisp prices in 2008. A box is equivalent to a carton tray pack or a 40 lb. unit.
Sources: USDA, AMS; USApple
These rising prices and the phenomenal valuations for Honeycrisp – along with near-zero interest rates following the 2008 financial crisis – spurred growers to make significant investments in their operations. The industry planted new, high-density orchards with dramatically higher yields. They built state-of-the-art storage facilities that could store apples better and longer than ever before. And they upgraded packing lines with sophisticated sorting equipment that could maximize fresh apple packouts and minimize culls.
In these halcyon days of the 2000s and early 2010s, the industry was in a virtuous cycle where growth in supply was accommodated by growth in demand and prices rose, thereby justifying further growth in supply. But these days couldn’t last forever. This was the first inflection point.
From 2013 to 2023, fresh apple prices plateaued, averaging around $35 per box. Total movement also flattened out, averaging around 145 million bushels per year. In 2015 and 2020 when movement spiked to around 155 million bushels, prices fell to around $32 per box following a now well-known inverse relationship.
However, something significant had changed between 2015 and 2020 – exports. As noted previously, when production jumped in 2015, exports also increased as shown in the corresponding peaks in movement in Figure 1. In 2020, when production surged, there was no matching peak in exports – domestic movement alone was left to absorb the shock.
Unfortunately, during this period, it’s not just that exports ceased functioning as a pressure relief valve, but they started to decrease in absolute terms. In 2018, India surpassed Canda to become the second-largest U.S. fresh apple export market, but, following a trade dispute, that market all but disappeared. By 2022, total fresh apple exports were down to 27 million bushels from a high of 47 million bushels in 2015 – a 42% decrease.2 In that short period, exports went from accounting for 30% of total movement to just 20%, putting significant pressure on domestic markets to make up the difference.
In 2024, the prior investments in new, high-yield orchards, advanced storage control systems and cutting-edge sorting technologies teamed up with Mother Nature to deliver a stunning blow. With production levels at all-time highs, total fresh apple movement exceeded 164 million bushels and prices crashed to around $28 per box. The following year in 2025, it happened again. Total movement volumes were around 158 million bushels and grower prices stayed below $29 per box. This was the second inflection point.
Sustainable Production
According to a 2024 study by Washington State University, these average prices were below the cost of production for several of the most prevalent varieties. In the case of Washington-grown Galas, Granny Smiths and Cosmic Crisps®, a minimum of around $30 per box is needed to cover the total cash costs required for economic sustainability in the short run. For Honeycrisps that figure is around $40 per box.3
Data on production costs combined with analysis of fresh apple movement and its relationship to prices is particularly useful as the industry strives towards economic sustainability. Using the $30 mark for most varieties and $40 for Honeycrisp, we can back into an approximate total fresh apple movement figure that remains economically viable. Based on the current levels of domestic consumption and exports, it seems that total movement of around 150 to 160 million bushels decreases the prices paid to growers below the cost of production for most varieties.
Setting aside exports for a moment, Figure 3 details the evolution of domestic fresh apple movement and grower prices by year. The scatter plot groups years based on similar demand curves: 2000-2005; 2006-2011; 2012-2013; 2014-2023; and 2024-2025.
As described above, for most of the 2000s, prices continued to rise as domestic movement increased moderately from around 80 to 90 million bushels. Prices peaked in 2012 and 2013 with the loss of Michigan’s crop and then changed trajectory in the following decade as domestic movement jumped to the 100-to-110-million-bushel range. At those levels, the average grower prices cluster around $35 per box which is enough to cover most the cost of growing, storing and packing most varieties, but not all. In the most recent shift with domestic shipments at or above 120 million bushels, the average prices paid to growers drop below the $30 break-even threshold for most varieties.
Figure 3: U.S. Domestic Fresh Apple Movement & Prices by Year
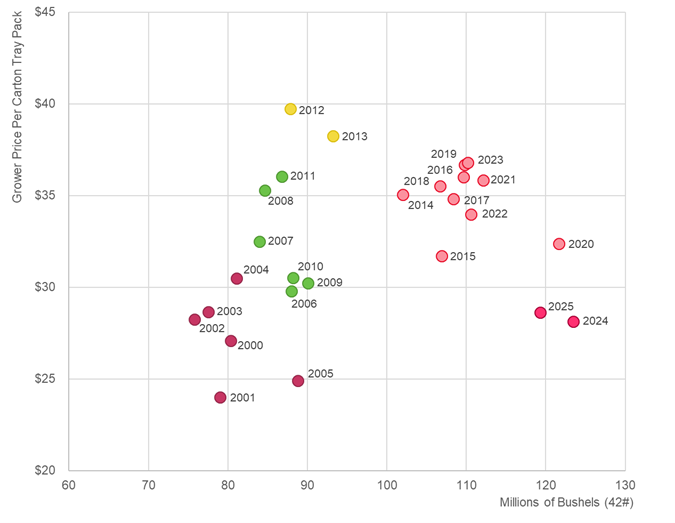
Note: Grower prices represent domestic shipments and are adjusted for inflation.
Sources: USDA, AMS; USApple
Charting a Path Forward
While time may be running short for some, there is still hope that the U.S. apple industry can get back to profitability without widespread farm or acreage loss. With that said, however, it may be prudent for growers to begin selectively removing the worst performing acreage as a means of controlling not just production capacity, but costs as well. Growers can realize similar benefits by maintaining discipline during harvest and avoiding fruit with challenging sizes and grades.
Depending on location, some commercial growers may also look to divert some of their apples directly to the consumer via u-pick or farm stand operations. While it is unlikely that this would significantly alter wholesale market conditions, it could provide enough incremental revenue to allow individual farms to stay in apple production until demand conditions improve.
With respect to improving demand conditions, there have been some encouraging signs in the export markets. In 2023, India removed retaliatory tariffs on U.S. apples and exporters began work on rebuilding that market. By 2025, India was once again a top five fresh apple export market, buying around two and half million bushels worth almost $43 million. There are also recent reports that India plans to further reduce tariffs on U.S. apples, but the exact nature of that agreement is not known. Taiwan, the third-largest fresh apple export market, has also reportedly agreed to reduce tariffs, but here again details are sketchy given the frequent and rapid changes in U.S. trade policy.
What is most concerning is the uncertainty around the status of the U.S., Mexico and Canda Agreement (USMCA) which is up for renewal in July 2026. This Agreement currently includes tariff exemptions for fruits and vegetables grown and packed in those countries. Renewing the USMCA and securing those exemptions is of paramount importance to U.S. apple growers. In 2025, the U.S. sent Mexico more than 16 million bushels worth $385 million and Canada received almost eight million bushels worth $165 million. This accounts for more than 50% of total U.S. fresh apple exports, a volume roughly equivalent to Michigan’s annual production.
Unfortunately, on the domestic demand front, consumption continues to decline. However, in a recent survey conducted by the Eat More ApplesTM campaign, there were a number of interesting findings that give some hope of reversing that trend. One in particular found that 76% of respondents buy fruit for health benefits, but only 32% buy apples for health benefits. This suggests that if the industry could do a better job of promoting the health and wellness benefits or eating apples, consumption may increase.
On the cost side, U.S. apple growers were thrown a lifeline in the Fall of 2025 when the U.S. Department of Labor changed the methodology used to calculate the H-2A labor rate also known as the Adverse Effect Wage Rate (AEWR). This change alone could save the industry millions of dollars and lengthen the runway for many on the edge. What the industry desperately needs now is for Congress to codify these new regulations into law and provide some certainty and stability going forward.
The next several years will see a lot of changes in the U.S. apple industry, but there is hope. With discipline around production, open export markets, effective domestic health messaging and reduced labor costs, more growers than not will make it through these challenging times and emerge stronger on the other side.
Editor: Chris Laughton
Contributors: Chris Gerlach
View previous editions of the KEP
Farm Credit East Disclaimer: The information provided in this communication/newsletter is not intended to be investment, tax, or legal advice and should not be relied upon by recipients for such purposes. Farm Credit East does not make any representation or warranty regarding the content, and disclaims any responsibility for the information, materials, third-party opinions, and data included in this report. In no event will Farm Credit East be liable for any decision made or actions taken by any person or persons relying on the information contained in this report.
2026 Apple Industry Outlook Webinar
Thursday, April 16, 2026
12:00 PM - 1:00 PM EDT
Join Farm Credit East, Horizon Farm Credit and Chris Gerlach of the U.S. Apple Association to discuss the future of the apple industry. This webinar will take a deep dive into the prevailing trends and forces shaping the U.S. apple industry. This webinar is free and open to all.
Tags: outlook, apple, ag economy, fruit
- Share this post on


