January 8, 2026
Dairy Industry Outlook: Dairy continues to be a growth category
Volume 20, Issue 1
January 2026
Contributed by CoBank dairy lead economist Corey Geiger and industry analyst Abbi Prins
If you own a dairy farm or work in the dairy industry, you are aware of the historic investment in U.S. dairy processing. Just two years ago, many were astonished when that number climbed to $8 billion. With the recent plant expansions in the works, that investment total stands on the cusp of $12 billion.
Now, there are dairy farmers who are reading this article and saying, “We are not seeing that investment translate into our milk checks.” That may be the near-term situation, especially in West coast markets where more milk goes into Class IV products such as butter and nonfat dry milk. These market ebbs and flows could persist as new plant production seeks customers. However, many dairy farmers also have the ability to grow their dairy farm enterprises which wasn’t the case five short years ago when many processors utilized base excess plans to better manage inbound milk needed for processing dairy products and ingredients.
Product demand is growing
In the 52-week window from November 2024 to November 2025, four dairy products ranked among the top ten for unit growth … think volume … among all food products in retail outlets. Yogurt, paced by the high-protein Greek yogurt category, is No. 2. Next in line was natural cheese at No. 3, according to Circana and DMI sales data. Rounding out the dairy quartet were cottage cheese at No. 6 and dairy creamers at No. 10.
These growth numbers are substantial with yogurt up 9.5%; cottage cheese climbed 14.5% and dairy creamers skyrocketed 31.9%. That last number - 31.9% - is not a typo. In addition, these sales numbers tracked by Circana and DMI do not consider the booming dairy protein shake market that has products with 30- to 40-plus grams of dairy protein packed in extended shelf-life beverage containers. These product sales are not tracked by traditional Class I beverage standards as most ingredients for these products come from Class II and Class IV milk sources.
The leading processing investments
When looking deeper into the nearly $12 billion investment in dairy processing, cheese plants lead the way at $3.2 billion. Nearly every cheese plant now coming online brings an equally important strategy to capture protein value from the whey stream. Whey is no longer a byproduct as in prior generations. It’s a co-product, meaning whey protein is equally important as the cheese itself.
Next in line is the $3 billion investment in fluid milk plants, many of which are making high-protein beverages and milk shakes from ultra-filtered milk. Unfortunately, these plants focusing on high-protein beverages are spinning off more sweet cream that must find a market home, which adds to the butterfat surplus. Also, the fluid milk category is focusing on lactose-free products. That’s important as 120 million Americans identify themselves as lactose intolerant or lactose sensitive.
Rounding out dairy’s “big three” is $2.8 billion in dairy plant investment for yogurt and cultured dairy products. Anchoring that category is Greek yogurt, and to a lesser extent cottage cheese, both products that are rich in protein. Overall, cheese and whey, fluid milk and yogurt plant investments cover just over 80% of the new and expanded dairy processing assets which stand as the leading testament for the value of dairy protein.
Two additional categories are seeing new investment with butter and powder facilities experiencing $1.6 billion growth and ice cream rounding out the category at $530 million.
New York, paced by yogurt and fluid milk, leads all states with $2.8 billion in investment. The Empire State has encouraged growth through tax credits and grants and has seen substantial investment when compared to its neighboring states.
Next on the list are Texas at $1.5 billion, Wisconsin, $1.1 billion; Idaho, $720 million; and Iowa, $701 million, according to the International Dairy Foods Association tabulations. As more of these plants come online, we will need to find new dairy customers both at home and around the world for the growth in dairy products and ingredients.
Butterfat moves to oversupply situation
When given financial incentives, U.S. farmers are extremely adept at producing the product in demand. Dairy farmers are no exception.
Exhibit 1

Over the past decade, butterfat led milk checks for eight of the 10 years as shown in Exhibit 1. By 2021, the nation’s milk supply broke a seven-decade-old record for butterfat content at 3.95%. Inspired by milk check incentives, those records were shattered every year since, and this year butterfat will post another record close at 4.3%. Keep in mind that butterfat levels were at 3.66% as recently as 2010.
Let’s turn to the facts about the present day supply situation: In 2023, butterfat production climbed 1.4% when compared to the previous year. Butterfat production improved a bit more with a 1.9% growth rate in 2024, when evaluating Federal Milk Marketing Order and USDA milk production data.
Exhibit 2

Then came 2025 as shown in Exhibit 2:
- 3.3% growth rate in butterfat output from January to March 2025
- 4.1% growth from April to June 2025
- 5.6% growth from July to September 2025
- 5.9% growth in October 2025
As a result, dairy processors are awash in butterfat, and some have even put in caps on butterfat payment levels on farmgate milk in response to the situation. A year ago, this butterfat cap would not have been on anyone’s decision-making radar. These caps mirror some of the base excess plans from a recent era where some processors placed ceilings on the pounds of liquid milk shipped to their respective processing plants.
To be clear, consumer demand for butterfat has not faltered. Butter product sales are up 4% on a year-over-year basis according to Circana and DMI data. In addition, dairy creamer sales rank among the top ten in unit growth categories among all products found in grocery stores. Plus, whole milk continues to gain momentum in the marketplace.
On top of that, butterfat exports totaled 158 million pounds through August. When comparing those sales to 2024, U.S. butter and anhydrous milk fat exporters have already exported 59% more pounds of butterfat than the entire 12 months of last year. This is noteworthy as we are still waiting for four months of export data.
Markets are searching for protein
In 2025, oversupplies of butterfat were a discussion topic at every dairy meeting across the nation. However, there’s no such discussion about protein caps. In fact, protein markets are as strong as ever and could remain so for many years to come as protein prices became the leading component in multiple component milk pricing markets as shown in Exhibit 1. Protein ranks as one of the must-have macronutrients among domestic and international consumers.
In addition, 23% of U.S. households are now using GLP-1 weight loss medications and those consumers have a stronger appetite for high protein foods to help maintain healthy muscle mass. Recent news about obesity drugs going mass-market and even being eligible for Medicare and Medicaid could put the protein trend in overdrive. This all points to the market reality that protein will be the leading driver in milk checks in the coming years.
While demand for yogurt, dairy protein shakes, cottage cheese and other high-protein dairy products continues to grow, there’s a another relatively new customer for dairy protein on the block – cheesemakers.
Not that long ago, American-style cheese makers were putting all the butterfat from farmgate milk into Cheddar and other similar cheeses. With the current butterfat levels, those processors need to standardize the milk and skim some butterfat in the form of sweet cream. The alternative is adding protein to the batch to make cheese. That protein can be milk protein concentrate, ultra-filtered milk or other protein sources.
With over 40% of the U.S. milk supply going into cheese, this situation has created an entirely new customer in the American-style cheese category. When it comes to some Italian-style cheese, many have been adding protein to batches for years.
Then there are the high-protein food markets. Just a year ago dairy top proteins, in the form of whey protein isolates (WPI), were consistently fetching $10 per pound. Now there are reports that WPI with 90% or higher protein content are selling over $12.50 per pound and customers would buy every pound if they could find it.
While no one is certain what the market topside is for whey proteins, demand signals for customers in America and around the world indicate that the protein boom will not slow anytime soon.
Fewer tools in the toolbox
Another reason to be bullish on protein is the fact that it is more challenging to produce on the dairy farm. While dairy farmers have feeding strategies and genetic tools to improve butterfat, the most economical improvement tool for protein is genetics, with few economically feasible feeding strategies available to significantly boost protein.
Then there’s the fact that if we put full selection pressure in genetic programs on protein, we will improve butterfat at roughly an 80% rate as the two traits are highly correlated. That means protein growth will be a slow roll, and the protein-to-butterfat ratio may not improve over the 0.80 threshold, continuing to negatively impact cheese quality and production.
The fifth and final Federal Milk Marketing Order amendment
The fifth and final Federal Milk Marketing Order amendment went into effect in December, with an adjustment to the milk composition factors. That amendment reset the baseline at 3.30% true protein. Overall, milk composition factors shifted:
- from 3.1% to 3.3% protein
- from 5.9% to 6.0% other solids
- from 9.0% to 9.3% nonfat solids
Exhibit 3
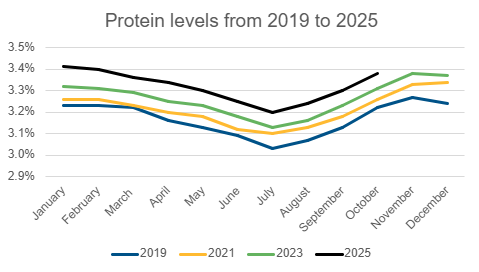
Now, the amendment will lead to deducts in milk checks should protein fall below 3.3%. Last year, on a national basis, June, July and August were the only months were protein levels fell below this metric when looking at shipments through the Federal Milk Marketing Order system as shown in Exhibit 3.
The revenue game changer
Exhibit 4
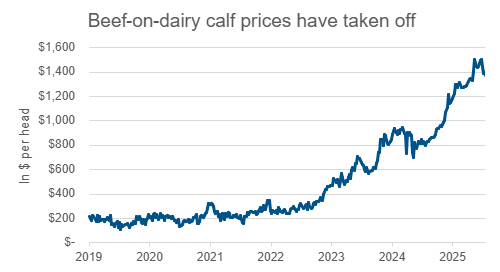
Speaking of protein trends, the beef-on-dairy movement has rewritten market signals related to milk, butterfat and protein. Some farms are now gathering as much as 20% to 25% of farm revenue from beef sales driven by calf prices pushing in the $1,200 to $1,500 range as shown in Exhibit 4. Unlike some other alternative revenue sources on dairy farms, the beef-on-dairy movement is an area where every dairy farmer has the option to enhance revenue.
To that end, the combined cull cow and calf sale category netted about $1 per hundredweight (cwt.) on a typical dairy farm in 2021. Fast forward four years and the financial contribution has grown exponentially. Cull cow sales alone moved to a $1.50 per cwt. contribution with calf sales jumping to $2.50 per cwt. for a net gain of over $4 per hundredweight by the summer of 2025.
Exhibit 5
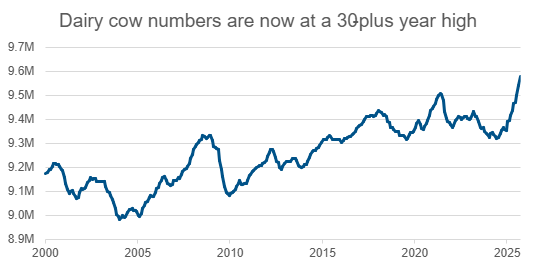
This market opportunity shows no signs of slowing over the next three years, and it potentially has a longer run as the U.S. beef cow herd stands at the lowest level since 1961. As a result, the number of steers and heifers destined for feedlots remains incredibly low and that has sent cattle futures to record highs. That, in turn, has caused the dairy cow herd to grow to its highest level in 30 years, as shown in Exhibit 5, due to these new margins for beef. In some markets, particularly in the Midwest and West, that could lead to excess milk and butterfat production in the near-term as the newborn calf has more net profit than milk sales.
Editor: Chris Laughton
Contributors: Corey Geiger, Lead Economist, Dairy, CoBank and Abbi Prins, Industry Analyst, CoBank
View previous editions of the KEP
Farm Credit East Disclaimer: The information provided in this communication/newsletter is not intended to be investment, tax, or legal advice and should not be relied upon by recipients for such purposes. Farm Credit East does not make any representation or warranty regarding the content, and disclaims any responsibility for the information, materials, third-party opinions, and data included in this report. In no event will Farm Credit East be liable for any decision made or actions taken by any person or persons relying on the information contained in this report.
2026 Dairy Industry Outlook Webinar
Thursday, January 29, 2026
12:00 PM - 1:00 PM EST
Join Farm Credit East, Horizon Farm Credit and CoBank's Corey Geiger for an outlook on what's ahead for the dairy industry in 2026. This webinar is free and open to all.
- Share this post on


