May 3, 2023
Farm Credit East Knowledge Exchange Industry Snapshots
Volume 17, Issue 5
May 2023
The National Economy
U.S. economic growth has slowed considerably, with real (inflation-adjusted) GDP growth coming in at 0.9% for 2022, compared with 5.7% in 2021. A contributor to this slowdown has been the Federal Reserve’s aggressive interest rate hikes, which occurred 7 times in 2022 and twice in 2023. The Fed has been raising rates in an effort to combat persistent high inflation, which has been challenging for businesses and consumers alike.
Inflation peaked in June 2022 at 9.1%, year-over-year, as measured by the Consumer Price Index. Since then, it has declined to 6.0% in February 2023, which, while an improvement, remains well above the Fed’s target inflation rate of 2%.
While inflation remains elevated, its downward trajectory, combined with the recent banking crisis, may give the Fed pause in making additional rate increases. Some analysts forecast the Fed may make one more quarter-point increase before leveling off, and hoping that the slowing economy and the previous interest rate increases are able to bring inflation closer to the target rate.
Economists forecast that while a shallow recession is a definite possibility, real GDP growth should still be modestly positive for 2023. Estimates range from 0.0% to 0.7% growth for 2023. Longer-term forecasts, while quite uncertain, project slowly rising economic growth for the U.S., with GDP growth coming in at 0.5-1.1% for 2024.
The labor market has remained remarkably tight, despite lackluster economic growth and high interest rates. Headline unemployment was at 3.6% in February, and the ratio of unemployed job seekers to job openings is only 0.5, meaning that there are roughly two open jobs for every job seeker in the economy. This makes hiring (and retaining employees) a significant challenge for employers in all sectors, including agriculture.
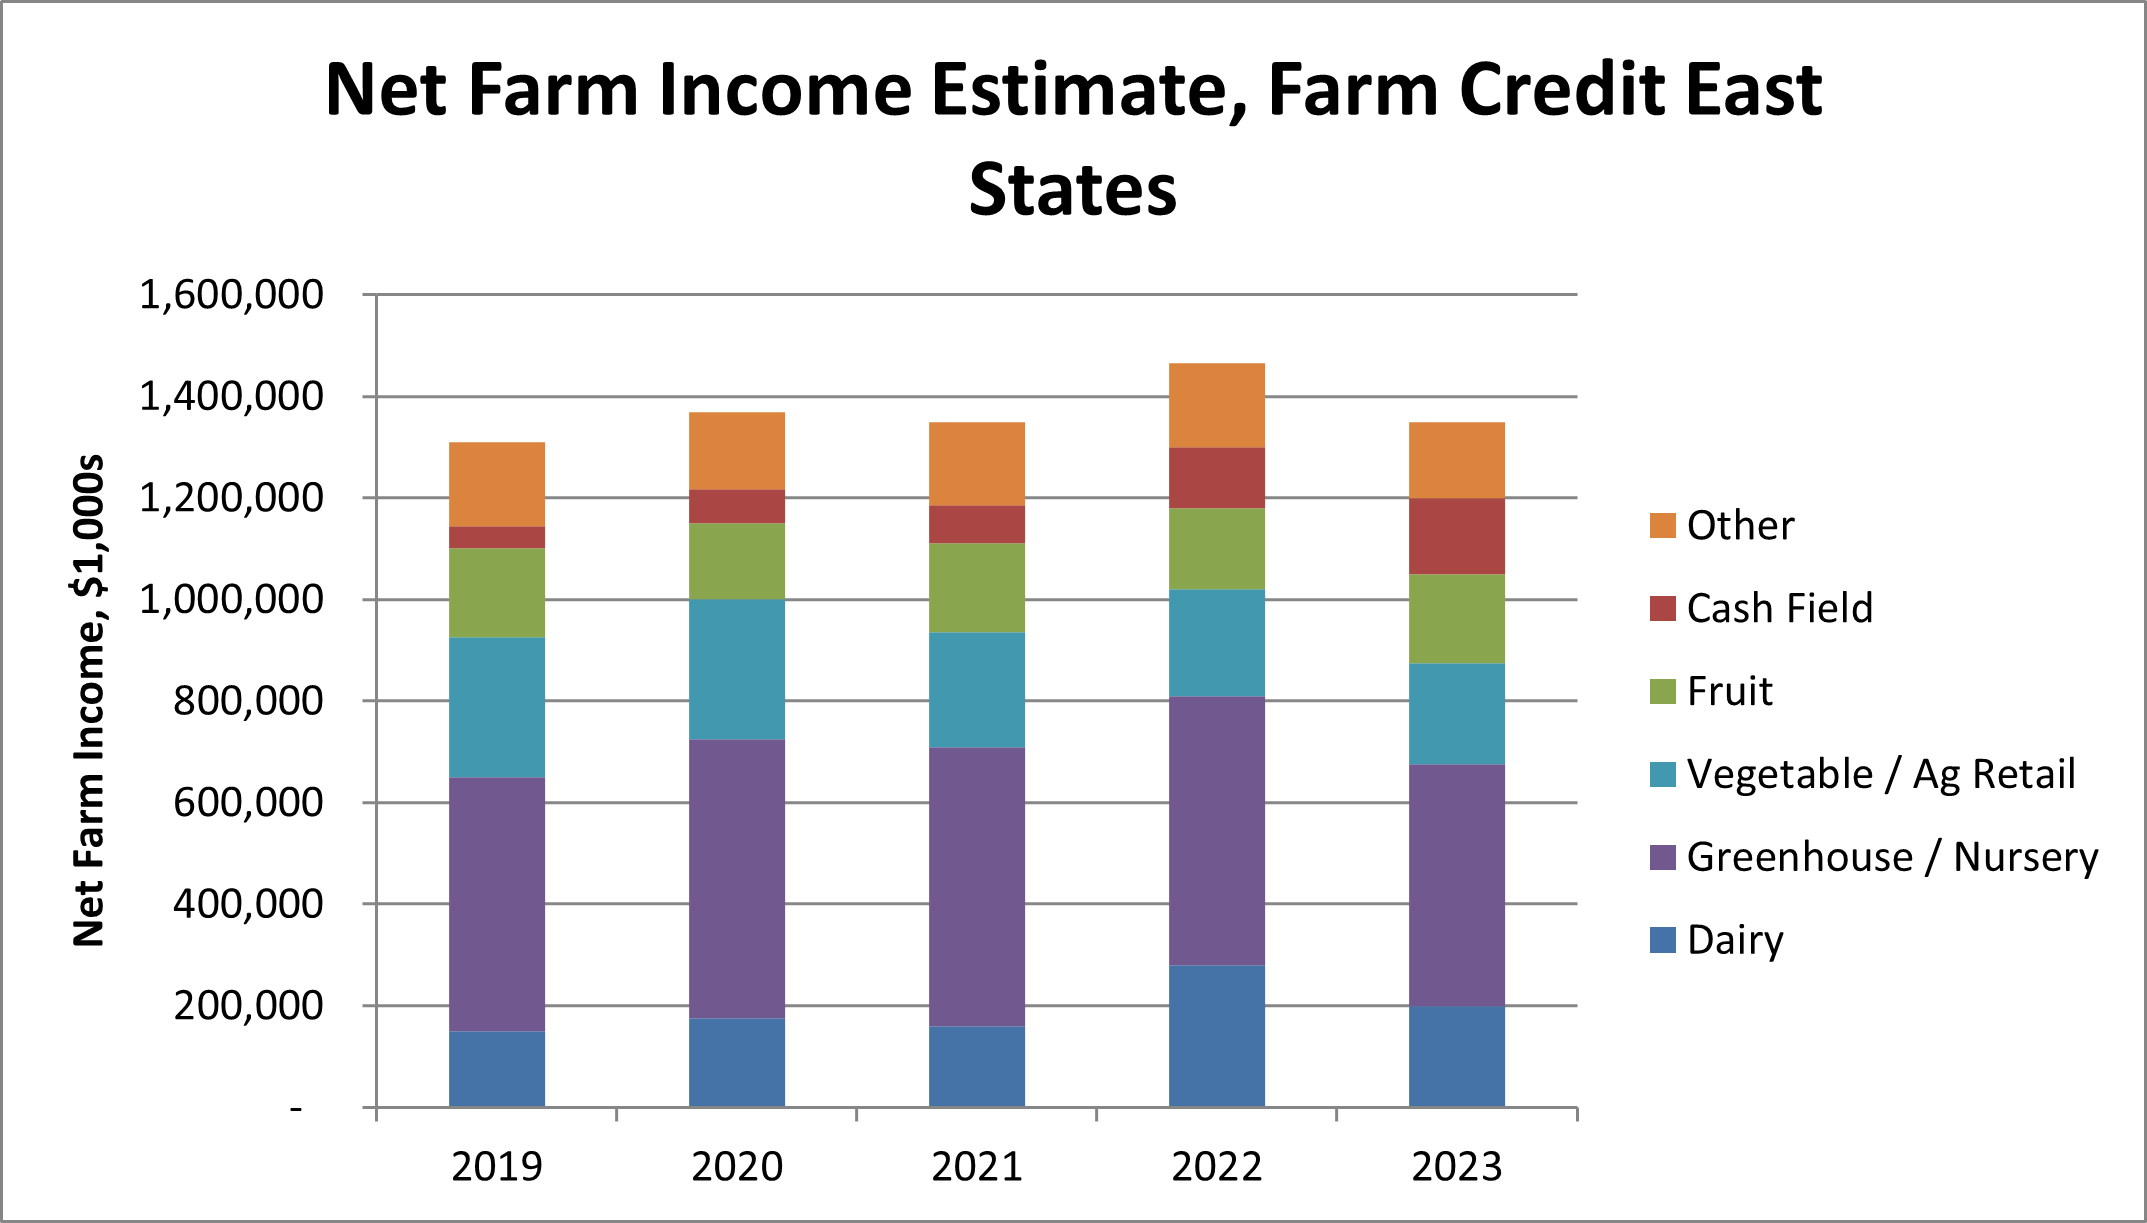
Source: USDA ERS & Farm Credit East Estimates. Does not include forest products or commercial fishing.
The Northeast Farm Economy
Dairy
| Avg. Price per Cwt. | 2020 | 2021 | 2022 | 2023 F |
| Boston Blend Price1 | 17.10 | 17.84 | 24.96 | 19.98 |
| Avg. WNY Blend2 | 16.00 | 16.85 | 23.92 | 20.62 |
| USDA All-Milk Price3 | 18.24 | 18.23 | 25.56 | 20.45 |
F=forecast. Note that normally the Boston Blend is higher than the WNY blend, but the forecasts have diverged, with Agri-Mark being more bearish than Upstate Niagara recently.
- February U.S. milk production increased 1.0% from February 2022. The national dairy herd increased, as did productivity per cow.
- On a state-by-state basis, in February, there were Y-O-Y increases in production in some major producing states, including, Idaho (3.4%), Michigan (3.1%), Texas (5.5%) and Wisconsin (0.3%). Notably, California (-0.9%), and New Mexico (-4.2%) showed declines. In the Northeast, New York had an increase of 2.9% Pennsylvania (-0.9%) and Vermont (-1.0%) showed decreases.4
- Milk prices have declined considerably from their highs in 2022. Boston Blend price averaged $19.70 in March, down substantially from the peak of $26.36 in July 2022. Prices are expected to range from $19-21 for the rest of 2023, and average $19.98 for the year.
- Input costs have risen, tightening margins for dairy producers. Labor, feed and other costs have risen significantly over the last 2 years.
Timber and Forest Products
Overview
After a few solid years for most all forest products markets in the Northeast, some sectors began to feel the impacts of the economic transition to a higher interest rate environment and economic uncertainty.
Both softwood and hardwood lumber demand have declined from their highs and trended to historical averages as home construction and improvement markets encounter reduced consumer and commercial demand. Labor, particularly skilled labor, is impacting all forest product operators, especially the logging and trucking sector. This has directly impacted the amount of wood timberland owners can manage and wood available to mills. Diesel price volatility has not helped logging and trucking operations as much as desired, and most timberland owners have increased service rates due to inflation and to maintain the financial health of the logging and trucking industries.
Northeast log prices maintained their elevated levels for all species throughout 2022. Initially higher from increased end forest products market demand, log prices were further supported by periods of reduced supply availability, particularly in the fourth quarter where the Northeast experienced a wetter and warmer fall and early winter season. There remains large volumes of fiber in the woods that required a hard freeze before being trucked to markets. This negatively impacted sawmill margins, particularly those with decreased lumber demand and lumber prices. Similarly, biomass availability was negatively impacted by the warmer weather, as fiber typically hauled and chipped for energy producers was left in the woods to offset wet and muddy conditions.
One welcome benefit to the Northeast forest products market has been the strong demand and pricing for hardwood pulpwood. Regional pulp and other producers cannot purchase enough fiber for production and have been forced to expand their procurement area and deploy concentration yards to ensure adequate fiber supply. Further, some pulp producers have even substituted softwood pulpwood when possible, bolstering the softwood low grade markets. The recent announcement of new long-term investments over $400MM from two large producers that purchase a substantial portion of low-grade wood in Northern New England has been welcomed by all market participants
Lumber
- Eastern SPF lumber prices reverted from their recent crest of ~$1,500/mbf to ~$450/mbf by December 2022. Current Eastern SPF lumber prices are now close to pre-COVID levels, with mills benefitting from a less volatile market. Notwithstanding, log inventories at SPF mills continue to be a major issue as a wetter and warmer fall and early winter season in the Northeast, which is a critical period for inventory building, prevented loggers and truckers from hauling wood to the mills. As a result, SPF log prices remain elevated at levels 30-40% higher compared to pre-COVID levels. Mills continue to pay these prices despite lumber prices decreases to ensure supply to their yard.
- Unlike its Eastern SPF and hardwood lumber peers, Eastern White Pine lumber prices have only marginally come off their record levels set shortly after the COVID-19 market disruption. Demand for Eastern White Pine remains robust with log costs to mills at or near record levels. Order files remain strong and mill production remains slightly down due to general labor constraints and log constraints. Strong residual pricing continues to offer mills multiple markets and enhanced profitability.
- In a reversal from the first part of 2022, the concern of low hardwood mill inventories has abated due to the significant easing of hardwood lumber demand over the past six months. Prices for red oak, hard maple, and yellow birch lumber have all decreased between 20-30% from their highs in summer 2022 and is largely attributable to higher economic uncertainty around the housing and home improvement markets. Mills have reacted with reduced production; however, any price benefits are not expected until well into 2023. Lower-grade hardwood lumber used for pallets, cants, and railroad ties remain solid. Hardwood mills continue to buy logs at elevated prices despite reduced lumber demand in fear of not having logs available to purchase should mills try to negotiate lower prices. However, hardwood log costs are positioned to decrease should demand trend lower and hardwood pulpwood markets remain strong.
Pulp and Paper
- The overall state of the market in the pulp and paper packaging sectors is characterized by solid demand (though down from 2021 highs), slower cost inflactioin and some downward pressure on prices for the first time in several years. Here are highlights from the key sectors based on customer feedback and Fastmarkets RISI:
- North American inventories are flush, paper markets are weakening a bit, and export demand from China has softened significantly, leading to sharper downwards pressure on U.S. pulp prices. Northern bleached softwood kraft (NBSK) mills are trying to fend off downward pressure but buyers appear to have the upper hand at this point. As a result, preliminary U.S. NBSK effective list prices decreased in a broad range -- to $1,710-1,730/ton, down $15-35/ ton. Southern bleached softwood kraft (SBSK) effective list prices dropped to $1,690-1,700. Price erosion has continued in softwood grades since the fall while hardwood market erosion accelerated this month
Logging
- The logging industry in the Northeast and across the county continues to face headwinds. High fuel prices and labor issues impacted the industry’s profitability in 2022 and similar challenges are expected in 2023.
Timberland
- Commercial timberland transaction activity in the Northeast continued the trend lower in the second half of 2022. Most notably, smaller timberland property transactions, including HBU sales, decreased compared to the elevated levels from the past few years, largely attributable to climbing interest rates and the uncertain economic horizon. Notwithstanding, improved hardwood and softwood pulpwood markets have provided timberland owners with opportunities to cut lower-quality tracts and/or improve existing stands that were previously economically prohibitive. Underlying strong demand from all mills for fiber continues to position timberland owners well, with logging and trucking capacity as the primary constraint.
Cash Field Crops
USDA Crop Forecast:
| 2020/21 | 2021/22 | 2022/23 F | |
| Corn Area Harvested (Mil. Acres) | 82.3 | 85.3 | 79.2 |
|
Corn Yield/Acre (bu.) |
171.4 | 176.7 | 173.3 |
| Corn Price ($/bu.) | $4.53 | $6.00 | $6.60 |
| Soybeans Area Harvested (Mil. Acres) | 82.6 | 86.3 | 86.3 |
| Soybean Yield/Acre | 51.0 | 51.7 | 49.5 |
| Soybean Price ($/bu.) | $10.80 | $13.30 | $14.30 |
Source: USDA WASDE
USDA Prospective Plantings:
| State & Crop |
2021 Acres (1,000s) |
2022 Acres | 2023 Prospective Acres | % Chg 2022-2023 |
| U.S.: Principal Crops | 317,119 | 312,113 | 318,100 | +0.3% |
|
U.S.: Corn |
93,252 | 88,579 | 91,996 | +4% |
| U.S.: Soybeans | 87,195 | 87,450 | 87,505 | -- |
| NY: Principal Crops | 2,744 | 2,837 | 3,024 | +7% |
| NY: Corn | 1,040 | 1,030 | 1,100 | +7% |
| NY: Soybeans | 325 | 350 | 355 | +1% |
Source: USDA NASS
- Prices for grains and oilseeds remain high and futures have risen lately, with September 2023 corn futures trading at $5.80/bu, and August soybean futures at $13.98/bu.5
- Export demand is forecast down slightly. Corn exports for the 2022/23 marketing year are projected at 1.85 billion bushels, below last year’s 2.47 billion bushels. Soybean exports for the 2022/23 marketing year are projected at 2.02 billion bushels, below last year’s 2.16 billion bushels. China has been a much more significant buyer of U.S. corn than in previous years and continues to be the leading destination for U.S. soybean exports, but economic turmoil there is forecast to affect its 2023 purchasing.
- Fertilizer availability has generally improved and prices have fallen but remain elevated by recent standards. Analysts forecast prices will continue to decline in 2023.
Livestock
- USDA forecasts rising prices for choice steers with 2022 average prices at $144.40/cwt. and 2023 prices forecast at $162/cwt.
- Likewise, broiler prices are estimated to have risen significantly at $1.41/lb. in 2022, but forecast to decline to $1.27 in 2023. Eggs are estimated at $2.82 oz for 2022, an increase of more than $1 over 2021’s average price of $1.19. Egg prices are forecast to decline to $2.12 in 2023, remaining elevated due to the impact of Avian Influenza.6
- Strong demand continues to support high prices for animal proteins, but supply will limit volume and rising feed, hay and other input costs will limit producer profits.
- Strong demand continues for local and value-added meats and poultry but some producers report limited availability of slaughter and processing capacity.
Fruit
- Tree Fruit: U.S. fresh apple holdings as of March 2023 totaled 62.0 million bushels, 7% lower than the inventories reported last March and 10% lower than the March five-year average. New York apple holdings (total) amounted to 6.15 million bushels, 20% below last year.7
- A severe cold snap has killed the flower buds of many peach trees throughout the region, and some growers project that they have lost the entire crop for 2023.
- Wine/Craft Beverage: Retail wine sales at tasting rooms in 2022 appear to have dropped back to historic baseline levels after an exceptional 2020 and 2021. Visitor numbers are down a bit, however, tasting fees remain strong. The 2022 grape crop was quite a bit smaller in some parts of NY (by as much as 33%) due to winter injury and a dry summer. Some varieties were impacted more than others. Wineries who buy most of their grapes had to pay only a bit more since there were ample supplies coming into the year. The greater impact was on growers.
- Cranberries: Many new cranberry beds have been developed in Massachusetts over the last year. The increase in cranberry bog renovation was fueled by the MDAR Cranberry Renovation Grant and the MA Cranberry Bog Renovation tax credit. It is too early in the year to start projecting 2023 yields. Cranberry bogs will be coming out of dormancy in the next few weeks and will need to start being frost protected. Pricing is projected to be stable from the previous year. Handlers are wrestling with increased production costs due to inflation which may put downward pressures on pricing. One concern for growers are town level restrictions being placed on removal of sand, a key input for cranberry production.
Vegetables / Potatoes
- Fresh market vegetables: Wholesale growers experienced substantial variation in market pricing in 2022 with some varieties bringing good prices in certain time periods while other varieties or times saw disappointing prices.
- Inflation in input costs reduced margins last year, but supply costs have fallen somewhat, and the availability of supplies like packaging is improving.
- CSAs and farm stands have seen some sales declines since the COVID-driven peak in 2020-2021. Growers are focused on right-sizing production to new consumer demand levels. Prepared foods have been a big hit in farm stands.
- Potatoes: Maine’s 2022 crop continues to move in an orderly manner through both normal and niche marketing channels. In addition to supplying the three main processors in the area, Maine once again has shipped fry quality potatoes to the Pacific Northwest. Last year the shipments went to Lamb Weston in Washington State, while this year the shipments were to Simplot in Idaho. Total volume shipped from the 2022 crop exceeded the 2021 crop shipments by 100k cwt and totaled 250k cwt. These shipments are nearing completion. This has kept demand and prices for Maine potatoes strong.
- Contract values for the 2023 growing season have not yet been settled in Maine, but are beginning to be settled across the country. In Idaho, growers rejected contract offers from all three major processors and the processors are now taking the contract offers directly to the growers. Negotiations are continuing in other areas, including Maine. Contract pricing is said to be 17%-22% higher. A contract with one of the smaller processors in Maine has been settled with an increase of 17%.
- Seed and tablestock markets continue to be strong, with price increases in the $2/cwt range compared to last year. The seed industry in Maine has experienced higher than normal disease readings that have required waivers to be approved by the State Seed Board in order to ensure sufficient supplies of seed to plant the 2023 Maine crop. Generally speaking, seed supplies are very tight across North America as well. Chipstock supplies have tightened in recent months, which has increased the price for open market chipstock supplies. Overall supplies of potatoes across the U.S. are approximately 3% lower compared to the prior year, while Maine supplies are 7% higher. This is likely due to a second strong year of production as previously mentioned.
Aquatic / Fishing
- Lobster: 2022’s abnormally high prices brought resistance from some consumers and wholesale buyers. Prices have since declined to closer to the five-year average which has helped with product movement.
- The ongoing concern regarding the endangered Northern Right Whale continues to concern the industry. Lobstermen will have to modify their gear and deal with area closures. The controversy surrounding the Monterey Bay Aquarium’s “avoid” rating continues. The Federal Omnibus Spending Bill, passed last fall contained a provision giving the industry a 6-year reprieve from new gear requirements which was simultaneously applauded by lobstermen and criticized by conservation groups.
- Scallops: Scallop pricing has trended down since January. The downward pressure is fueled by the uncertainty in the general economy, the increased cost of processing, and tempered demand within the retail sector due to inflation. Key industry players are citing general inflationary trends curbing seafood sales across the board. There is optimism that once the warm weather hits pricing will increase, and consumer demand will rise.
- The scallop fishery is generally considered well-managed and there is no evidence of overfishing. Scallop availability levels, as witnessed by annual landings, have recently come off a cyclical peak, with annual landings ranging from 51 MM to 60 MM lbs. from 2017-2019. Although the fishery is healthy, biomass and landings dipped in 2020 (41 MM lbs.) and 2021 (40 MM lbs.) with further reductions in 2022 and expected in 2023, which should result in stable but lower production. The New England Fisheries Management Council is estimating the 2022 US harvest of scallops will come in at 34 MM lbs. The 2023-2024 fishing year is looking to have 24 open days-at-sea and two 12,000 lb. closed area trips, with a projection of approximately 25 MM lbs., a 9M lb. reduction from fishing year 2022’s projected landings. This is due primarily to a decrease in harvestable biomass and a lack of significant scallop recruitment in recent years.
- Groundfish: General inflationary trends and the uncertainty in the general economy are curbing seafood sales across the board. The increased cost of production at processing facilities, increased cost of cold storage and tempered demand within the retail sector has caused a downward trend in seafood pricing. The groundfish catch has been stable. Quota measures from NOAA have decreased catch limits in a few sectors while others remain flat year over year.
Greenhouse, Nursery and Sod
- The Green industry is coming off of several strong years, but the rate of growth is slowing down. Results in the industry have been variable over the past year, wich some seeing continued strong growth, while others have seen modest declines.
- Similarly, most growers have been able to raise prices in recent seasons, but prices have largely stabilized at this point. Still, rising costs have cut into profit margins. One piece of good news on the cost front is that trucking rates have decreased significantly from last year.
- 2023 spring nursery sales in Southern states have been encouraging.
- Product shortages have largely resolved, and some producers report having moderate excesses.
- Many growers noticed a big drop in sales last summer and are anticipating a similar scenario this year, but are still expecting a solid spring selling season.
1 Agri-Mark Price Forecast
2 Upstate Niagara Price Forecast
3 USDA World Agricultural Supply and Demand Estimate (WASDE)
4 USDA NASS Milk Production Report
5 CBOT Futures
6 USDA WASDE
7 USApple
Editor: Chris Laughton
Contributors: Tom Cosgrove and Chris Laughton
View previous editions of the KEP
Farm Credit East Disclaimer: The information provided in this communication/newsletter is not intended to be investment, tax, or legal advice and should not be relied upon by recipients for such purposes. Farm Credit East does not make any representation or warranty regarding the content, and disclaims any responsibility for the information, materials, third-party opinions, and data included in this report. In no event will Farm Credit East be liable for any decision made or actions taken by any person or persons relying on the information contained in this report.
Tags: outlook, cash field, economy, apple, aquatic, commercial fishing, dairy, forestry, fruit, greenhouse, livestock, logging, lumber, nursery, timber, vegetable, wine
- Share this post on


